White/Caucasian vs Yaqui No Schooling Completed
COMPARE
White/Caucasian
Yaqui
No Schooling Completed
No Schooling Completed Comparison
Whites/Caucasians
Yaqui
1.6%
NO SCHOOLING COMPLETED
99.9/ 100
METRIC RATING
49th/ 347
METRIC RANK
2.4%
NO SCHOOLING COMPLETED
0.8/ 100
METRIC RATING
256th/ 347
METRIC RANK
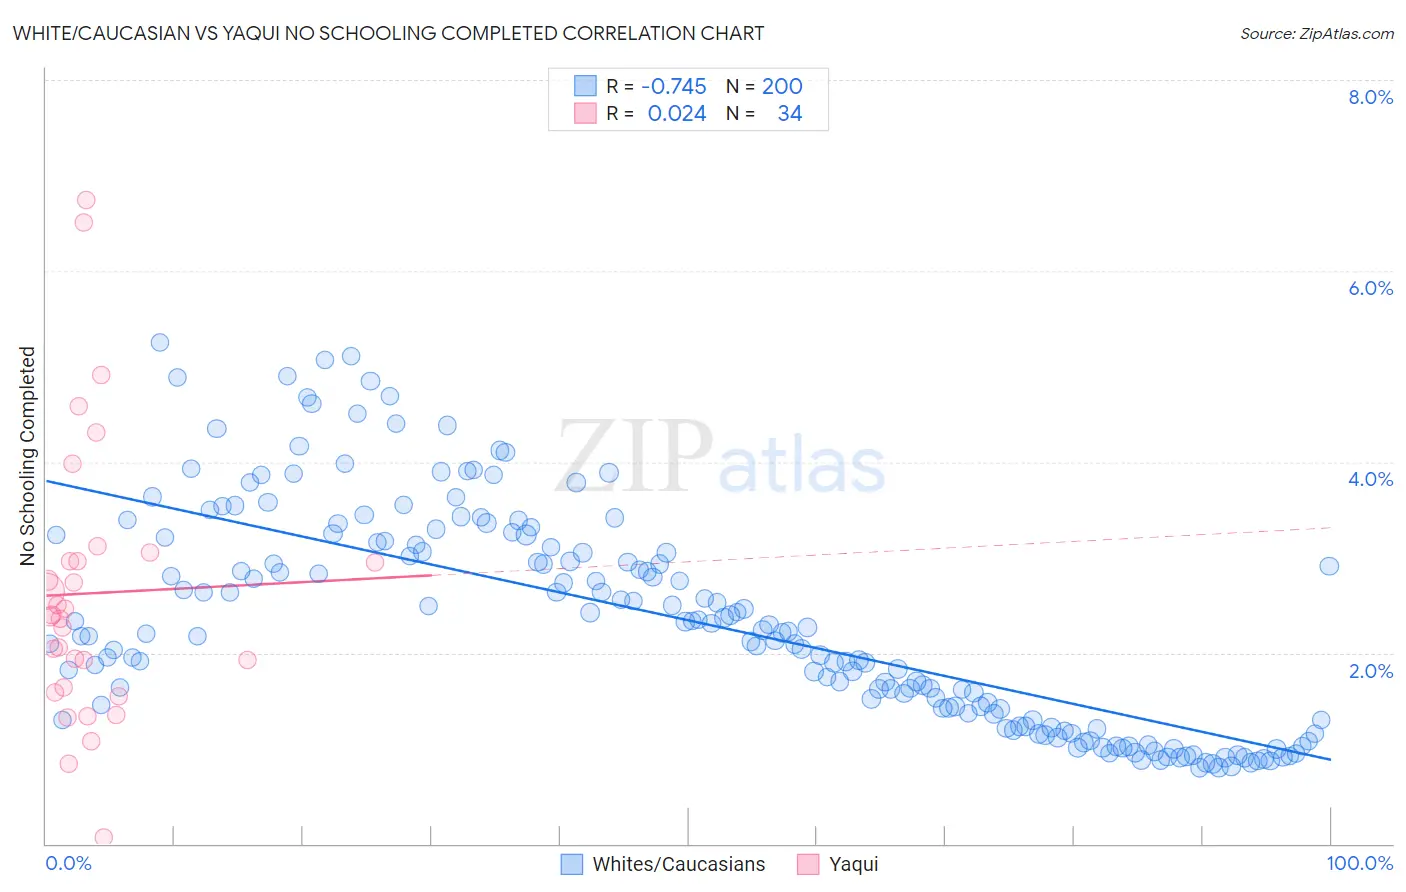
White/Caucasian vs Yaqui No Schooling Completed Correlation Chart
The statistical analysis conducted on geographies consisting of 562,623,303 people shows a strong negative correlation between the proportion of Whites/Caucasians and percentage of population with no schooling in the United States with a correlation coefficient (R) of -0.745 and weighted average of 1.6%. Similarly, the statistical analysis conducted on geographies consisting of 107,378,614 people shows no correlation between the proportion of Yaqui and percentage of population with no schooling in the United States with a correlation coefficient (R) of 0.024 and weighted average of 2.4%, a difference of 49.1%.
No Schooling Completed Correlation Summary
| Measurement | White/Caucasian | Yaqui |
| Minimum | 0.80% | 0.072% |
| Maximum | 5.2% | 6.7% |
| Range | 4.5% | 6.7% |
| Mean | 2.3% | 2.6% |
| Median | 2.2% | 2.4% |
| Interquartile 25% (IQ1) | 1.3% | 1.6% |
| Interquartile 75% (IQ3) | 3.2% | 3.0% |
| Interquartile Range (IQR) | 1.9% | 1.3% |
| Standard Deviation (Sample) | 1.1% | 1.4% |
| Standard Deviation (Population) | 1.1% | 1.4% |
Similar Demographics by No Schooling Completed
Demographics Similar to Whites/Caucasians by No Schooling Completed
In terms of no schooling completed, the demographic groups most similar to Whites/Caucasians are Immigrants from Scotland (1.6%, a difference of 0.060%), Celtic (1.6%, a difference of 0.13%), Ottawa (1.6%, a difference of 0.31%), Chippewa (1.6%, a difference of 0.34%), and Immigrants from Canada (1.6%, a difference of 0.41%).
| Demographics | Rating | Rank | No Schooling Completed |
| Bulgarians | 99.9 /100 | #42 | Exceptional 1.6% |
| Australians | 99.9 /100 | #43 | Exceptional 1.6% |
| Estonians | 99.9 /100 | #44 | Exceptional 1.6% |
| Czechoslovakians | 99.9 /100 | #45 | Exceptional 1.6% |
| Maltese | 99.9 /100 | #46 | Exceptional 1.6% |
| Ottawa | 99.9 /100 | #47 | Exceptional 1.6% |
| Immigrants | Scotland | 99.9 /100 | #48 | Exceptional 1.6% |
| Whites/Caucasians | 99.9 /100 | #49 | Exceptional 1.6% |
| Celtics | 99.9 /100 | #50 | Exceptional 1.6% |
| Chippewa | 99.8 /100 | #51 | Exceptional 1.6% |
| Immigrants | Canada | 99.8 /100 | #52 | Exceptional 1.6% |
| Creek | 99.8 /100 | #53 | Exceptional 1.6% |
| Crow | 99.8 /100 | #54 | Exceptional 1.6% |
| Greeks | 99.8 /100 | #55 | Exceptional 1.6% |
| Immigrants | North America | 99.8 /100 | #56 | Exceptional 1.6% |
Demographics Similar to Yaqui by No Schooling Completed
In terms of no schooling completed, the demographic groups most similar to Yaqui are Ethiopian (2.4%, a difference of 0.17%), Immigrants from Eastern Africa (2.4%, a difference of 0.37%), Immigrants from Asia (2.4%, a difference of 0.50%), Immigrants from Colombia (2.4%, a difference of 0.62%), and Immigrants from South America (2.5%, a difference of 0.87%).
| Demographics | Rating | Rank | No Schooling Completed |
| Jamaicans | 1.2 /100 | #249 | Tragic 2.4% |
| Immigrants | Middle Africa | 1.1 /100 | #250 | Tragic 2.4% |
| Immigrants | Africa | 1.1 /100 | #251 | Tragic 2.4% |
| Immigrants | Colombia | 1.0 /100 | #252 | Tragic 2.4% |
| Immigrants | Asia | 0.9 /100 | #253 | Tragic 2.4% |
| Immigrants | Eastern Africa | 0.9 /100 | #254 | Tragic 2.4% |
| Ethiopians | 0.8 /100 | #255 | Tragic 2.4% |
| Yaqui | 0.8 /100 | #256 | Tragic 2.4% |
| Immigrants | South America | 0.6 /100 | #257 | Tragic 2.5% |
| Assyrians/Chaldeans/Syriacs | 0.6 /100 | #258 | Tragic 2.5% |
| Immigrants | Jamaica | 0.6 /100 | #259 | Tragic 2.5% |
| Immigrants | Ethiopia | 0.6 /100 | #260 | Tragic 2.5% |
| Armenians | 0.5 /100 | #261 | Tragic 2.5% |
| Immigrants | Sierra Leone | 0.5 /100 | #262 | Tragic 2.5% |
| Immigrants | Liberia | 0.4 /100 | #263 | Tragic 2.5% |