Vietnamese vs Immigrants from Switzerland No Schooling Completed

COMPARE

Vietnamese
Race
Ancestry
AfghanAfricanAlaska NativeAlaskan AthabascanAlbanianAleutAlsatianAmericanApacheArabArapahoArgentineanArmenianAssyrian/Chaldean/SyriacAustralianAustrianBahamianBangladeshiBarbadianBasqueBelgianBelizeanBermudanBhutaneseBlackfeetBolivianBrazilianBritishBritish West IndianBulgarianBurmeseCajunCambodianCanadianCape VerdeanCarpatho RusynCelticCentral AmericanCentral American IndianCherokeeCheyenneChickasawChileanChineseChippewaChoctawColombianColvilleComancheCosta RicanCreeCreekCroatianCrowCubanCypriotCzechCzechoslovakianDanishDelawareDominicanDutchDutch West IndianEastern EuropeanEcuadorianEgyptianEnglishEstonianEthiopianEuropeanFijianFilipinoFinnishFrenchFrench American IndianFrench CanadianGermanGerman RussianGhanaianGreekGuamanian/ChamorroGuatemalanGuyaneseHaitianHmongHonduranHopiHoumaHungarianIcelanderIndian (Asian)IndonesianInupiatIranianIraqiIrishIroquoisIsraeliItalianJamaicanJapaneseJordanianKenyanKiowaKoreanLaotianLatvianLebaneseLiberianLithuanianLumbeeLuxembourgerMacedonianMalaysianMalteseMarshalleseMenomineeMexicanMexican American IndianMongolianMoroccanNative HawaiianNavajoNepaleseNew ZealanderNicaraguanNigerianNorthern EuropeanNorwegianOkinawanOsageOttawaPaiutePakistaniPalestinianPanamanianParaguayanPennsylvania GermanPeruvianPimaPolishPortuguesePotawatomiPuebloPuerto RicanPuget Sound SalishRomanianRussianSalvadoranSamoanScandinavianScotch-IrishScottishSeminoleSenegaleseSerbianShoshoneSierra LeoneanSiouxSlavicSlovakSloveneSomaliSouth AfricanSouth AmericanSouth American IndianSoviet UnionSpaniardSpanishSpanish AmericanSpanish American IndianSri LankanSubsaharan AfricanSudaneseSwedishSwissSyrianTaiwaneseThaiTlingit-HaidaTohono O'OdhamTonganTrinidadian and TobagonianTsimshianTurkishU.S. Virgin IslanderUgandanUkrainianUruguayanUteVenezuelanVietnameseWelshWest IndianYakamaYaquiYugoslavianYumanYup'ikZimbabwean
Immigration
NonimmigrantsImmigrantsAfghanistanAfricaAlbaniaArgentinaArmeniaAsiaAustraliaAustriaBahamasBangladeshBarbadosBelarusBelgiumBelizeBoliviaBosnia and HerzegovinaBrazilBulgariaBurma/MyanmarCabo VerdeCambodiaCameroonCanadaCaribbeanCentral AmericaChileChinaColombiaCongoCosta RicaCroatiaCubaCzechoslovakiaDenmarkDominicaDominican RepublicEastern AfricaEastern AsiaEastern EuropeEcuadorEgyptEl SalvadorEnglandEritreaEthiopiaEuropeFijiFranceGermanyGhanaGreeceGrenadaGuatemalaGuyanaHaitiHondurasHong KongHungaryIndiaIndonesiaIranIraqIrelandIsraelItalyJamaicaJapanJordanKazakhstanKenyaKoreaKuwaitLaosLatin AmericaLatviaLebanonLiberiaLithuaniaMalaysiaMexicoMicronesiaMiddle AfricaMoldovaMoroccoNepalNetherlandsNicaraguaNigeriaNorth AmericaNorth MacedoniaNorthern AfricaNorthern EuropeNorwayOceaniaPakistanPanamaPeruPhilippinesPolandPortugalRomaniaRussiaSaudi ArabiaScotlandSenegalSerbiaSierra LeoneSingaporeSomaliaSouth AfricaSouth AmericaSouth Central AsiaSouth Eastern AsiaSouthern EuropeSpainSri LankaSt. Vincent and the GrenadinesSudanSwedenSyriaTaiwanThailandTrinidad and TobagoTurkeyUgandaUkraineUruguayUzbekistanVenezuelaVietnamWest IndiesWestern AfricaWestern AsiaWestern EuropeYemenZaireZimbabweAzores
Immigrants from Switzerland
Race
Ancestry
AfghanAfricanAlaska NativeAlaskan AthabascanAlbanianAleutAlsatianAmericanApacheArabArapahoArgentineanArmenianAssyrian/Chaldean/SyriacAustralianAustrianBahamianBangladeshiBarbadianBasqueBelgianBelizeanBermudanBhutaneseBlackfeetBolivianBrazilianBritishBritish West IndianBulgarianBurmeseCajunCambodianCanadianCape VerdeanCarpatho RusynCelticCentral AmericanCentral American IndianCherokeeCheyenneChickasawChileanChineseChippewaChoctawColombianColvilleComancheCosta RicanCreeCreekCroatianCrowCubanCypriotCzechCzechoslovakianDanishDelawareDominicanDutchDutch West IndianEastern EuropeanEcuadorianEgyptianEnglishEstonianEthiopianEuropeanFijianFilipinoFinnishFrenchFrench American IndianFrench CanadianGermanGerman RussianGhanaianGreekGuamanian/ChamorroGuatemalanGuyaneseHaitianHmongHonduranHopiHoumaHungarianIcelanderIndian (Asian)IndonesianInupiatIranianIraqiIrishIroquoisIsraeliItalianJamaicanJapaneseJordanianKenyanKiowaKoreanLaotianLatvianLebaneseLiberianLithuanianLumbeeLuxembourgerMacedonianMalaysianMalteseMarshalleseMenomineeMexicanMexican American IndianMongolianMoroccanNative HawaiianNavajoNepaleseNew ZealanderNicaraguanNigerianNorthern EuropeanNorwegianOkinawanOsageOttawaPaiutePakistaniPalestinianPanamanianParaguayanPennsylvania GermanPeruvianPimaPolishPortuguesePotawatomiPuebloPuerto RicanPuget Sound SalishRomanianRussianSalvadoranSamoanScandinavianScotch-IrishScottishSeminoleSenegaleseSerbianShoshoneSierra LeoneanSiouxSlavicSlovakSloveneSomaliSouth AfricanSouth AmericanSouth American IndianSoviet UnionSpaniardSpanishSpanish AmericanSpanish American IndianSri LankanSubsaharan AfricanSudaneseSwedishSwissSyrianTaiwaneseThaiTlingit-HaidaTohono O'OdhamTonganTrinidadian and TobagonianTsimshianTurkishU.S. Virgin IslanderUgandanUkrainianUruguayanUteVenezuelanWelshWest IndianYakamaYaquiYugoslavianYumanYup'ikZimbabwean
Immigration
NonimmigrantsImmigrantsAfghanistanAfricaAlbaniaArgentinaArmeniaAsiaAustraliaAustriaBahamasBangladeshBarbadosBelarusBelgiumBelizeBoliviaBosnia and HerzegovinaBrazilBulgariaBurma/MyanmarCabo VerdeCambodiaCameroonCanadaCaribbeanCentral AmericaChileChinaColombiaCongoCosta RicaCroatiaCubaCzechoslovakiaDenmarkDominicaDominican RepublicEastern AfricaEastern AsiaEastern EuropeEcuadorEgyptEl SalvadorEnglandEritreaEthiopiaEuropeFijiFranceGermanyGhanaGreeceGrenadaGuatemalaGuyanaHaitiHondurasHong KongHungaryIndiaIndonesiaIranIraqIrelandIsraelItalyJamaicaJapanJordanKazakhstanKenyaKoreaKuwaitLaosLatin AmericaLatviaLebanonLiberiaLithuaniaMalaysiaMexicoMicronesiaMiddle AfricaMoldovaMoroccoNepalNetherlandsNicaraguaNigeriaNorth AmericaNorth MacedoniaNorthern AfricaNorthern EuropeNorwayOceaniaPakistanPanamaPeruPhilippinesPolandPortugalRomaniaRussiaSaudi ArabiaScotlandSenegalSerbiaSierra LeoneSingaporeSomaliaSouth AfricaSouth AmericaSouth Central AsiaSouth Eastern AsiaSouthern EuropeSpainSri LankaSt. Vincent and the GrenadinesSudanSwedenSwitzerlandSyriaTaiwanThailandTrinidad and TobagoTurkeyUgandaUkraineUruguayUzbekistanVenezuelaVietnamWest IndiesWestern AfricaWestern AsiaWestern EuropeYemenZaireZimbabweAzores
No Schooling Completed
Income
Poverty
Unemployment
Labor Participation
Family Structure
Vehicle Availability
Education Level
Disability

No Schooling Completed Comparison

Vietnamese

Immigrants from Switzerland

Tragic
Exceptional
3.2%
NO SCHOOLING COMPLETED
0.0/ 100
METRIC RATING
323rd/ 347
METRIC RANK
1.8%
NO SCHOOLING COMPLETED
97.9/ 100
METRIC RATING
102nd/ 347
METRIC RANK

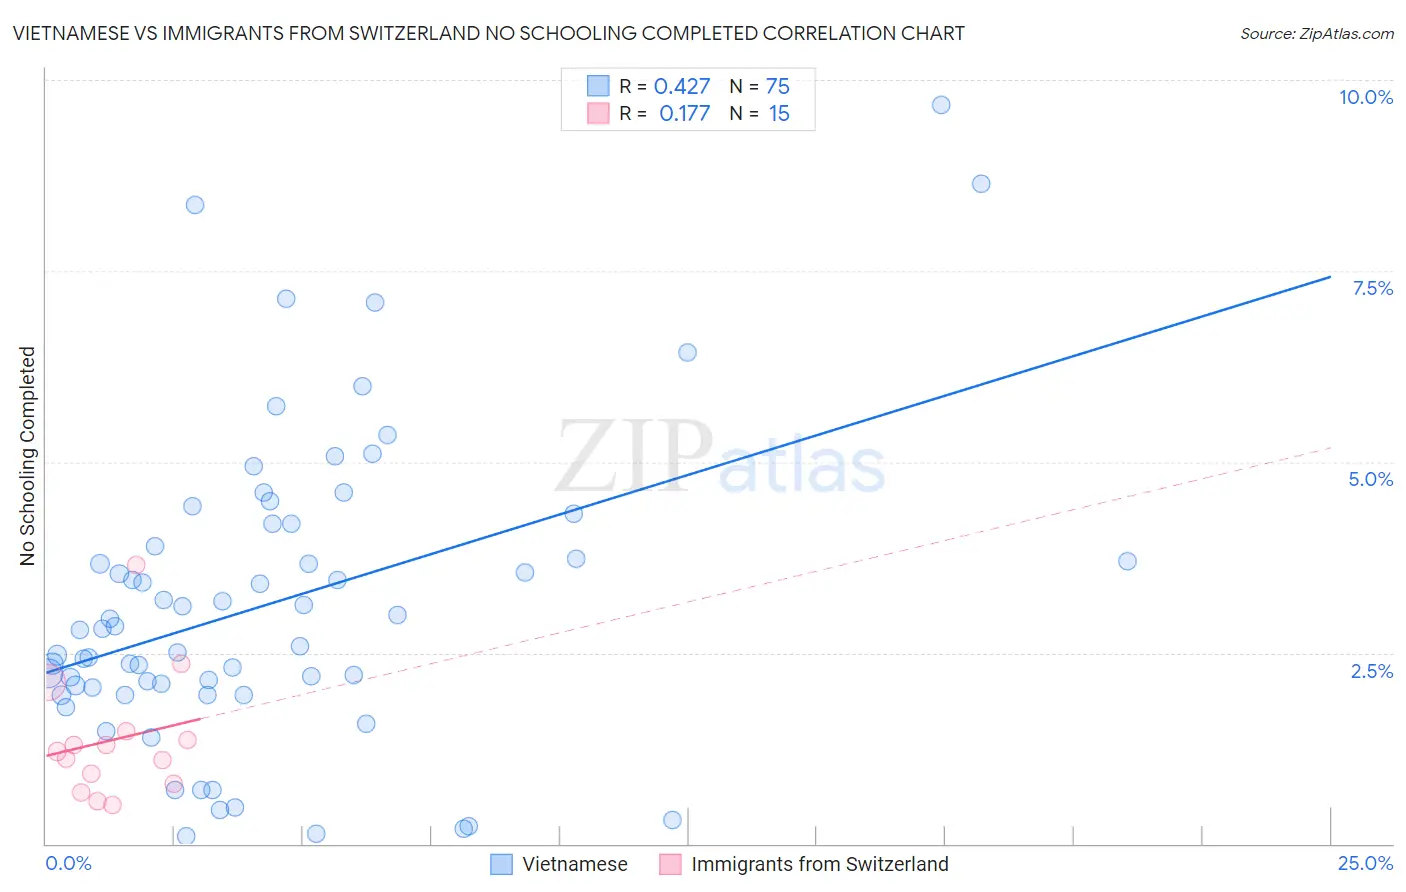
Vietnamese vs Immigrants from Switzerland No Schooling Completed Correlation Chart

The statistical analysis conducted on geographies consisting of 170,340,562 people shows a moderate positive correlation between the proportion of Vietnamese and percentage of population with no schooling in the United States with a correlation coefficient (R) of 0.427 and weighted average of 3.2%. Similarly, the statistical analysis conducted on geographies consisting of 147,132,968 people shows a poor positive correlation between the proportion of Immigrants from Switzerland and percentage of population with no schooling in the United States with a correlation coefficient (R) of 0.177 and weighted average of 1.8%, a difference of 74.4%.
Vietnamese vs Immigrants from Switzerland No Schooling Completed

No Schooling Completed Correlation Summary

MeasurementVietnameseImmigrants from Switzerland
Minimum0.099%0.51%
Maximum9.7%3.7%
Range9.6%3.1%
Mean3.1%1.4%
Median2.8%1.2%
Interquartile 25% (IQ1)2.0%0.79%
Interquartile 75% (IQ3)4.2%1.5%
Interquartile Range (IQR)2.1%0.68%
Standard Deviation (Sample)2.0%0.82%
Standard Deviation (Population)2.0%0.79%

Similar Demographics by No Schooling Completed

Demographics Similar to Vietnamese by No Schooling Completed

In terms of no schooling completed, the demographic groups most similar to Vietnamese are Immigrants from Honduras (3.2%, a difference of 0.19%), Mexican American Indian (3.2%, a difference of 0.34%), Immigrants from Laos (3.1%, a difference of 0.86%), Immigrants from Bangladesh (3.1%, a difference of 0.98%), and Immigrants from Burma/Myanmar (3.1%, a difference of 1.0%).
DemographicsRating | RankNo Schooling Completed
Immigrants | Ecuador
0.0
/100
|
#316
Tragic
3.1%
Cape Verdeans
0.0
/100
|
#317
Tragic
3.1%
Immigrants | Guyana
0.0
/100
|
#318
Tragic
3.1%
Immigrants | Burma/Myanmar
0.0
/100
|
#319
Tragic
3.1%
Immigrants | Bangladesh
0.0
/100
|
#320
Tragic
3.1%
Immigrants | Laos
0.0
/100
|
#321
Tragic
3.1%
Immigrants | Honduras
0.0
/100
|
#322
Tragic
3.2%
Vietnamese
0.0
/100
|
#323
Tragic
3.2%
Mexican American Indians
0.0
/100
|
#324
Tragic
3.2%
Dominicans
0.0
/100
|
#325
Tragic
3.2%
Indonesians
0.0
/100
|
#326
Tragic
3.2%
Immigrants | Latin America
0.0
/100
|
#327
Tragic
3.3%
Mexicans
0.0
/100
|
#328
Tragic
3.3%
Immigrants | Vietnam
0.0
/100
|
#329
Tragic
3.3%
Immigrants | Armenia
0.0
/100
|
#330
Tragic
3.3%

Demographics Similar to Immigrants from Switzerland by No Schooling Completed

In terms of no schooling completed, the demographic groups most similar to Immigrants from Switzerland are Immigrants from Czechoslovakia (1.8%, a difference of 0.0%), Basque (1.8%, a difference of 0.050%), Immigrants from Singapore (1.8%, a difference of 0.30%), Choctaw (1.8%, a difference of 0.50%), and Thai (1.8%, a difference of 0.63%).
DemographicsRating | RankNo Schooling Completed
Puget Sound Salish
98.5
/100
|
#95
Exceptional
1.8%
Bhutanese
98.4
/100
|
#96
Exceptional
1.8%
Immigrants | Ireland
98.4
/100
|
#97
Exceptional
1.8%
Iranians
98.2
/100
|
#98
Exceptional
1.8%
Choctaw
98.1
/100
|
#99
Exceptional
1.8%
Immigrants | Singapore
98.0
/100
|
#100
Exceptional
1.8%
Immigrants | Czechoslovakia
97.9
/100
|
#101
Exceptional
1.8%
Immigrants | Switzerland
97.9
/100
|
#102
Exceptional
1.8%
Basques
97.9
/100
|
#103
Exceptional
1.8%
Thais
97.5
/100
|
#104
Exceptional
1.8%
German Russians
97.5
/100
|
#105
Exceptional
1.8%
Immigrants | France
97.3
/100
|
#106
Exceptional
1.8%
Yugoslavians
97.2
/100
|
#107
Exceptional
1.8%
Okinawans
97.1
/100
|
#108
Exceptional
1.8%
Immigrants | Saudi Arabia
96.8
/100
|
#109
Exceptional
1.9%