Ukrainian vs Immigrants from Bolivia Master's Degree

COMPARE

Ukrainian
Race
Ancestry
AfghanAfricanAlaska NativeAlaskan AthabascanAlbanianAleutAlsatianAmericanApacheArabArapahoArgentineanArmenianAssyrian/Chaldean/SyriacAustralianAustrianBahamianBangladeshiBarbadianBasqueBelgianBelizeanBermudanBhutaneseBlackfeetBolivianBrazilianBritishBritish West IndianBulgarianBurmeseCajunCambodianCanadianCape VerdeanCarpatho RusynCelticCentral AmericanCentral American IndianCherokeeCheyenneChickasawChileanChineseChippewaChoctawColombianColvilleComancheCosta RicanCreeCreekCroatianCrowCubanCypriotCzechCzechoslovakianDanishDelawareDominicanDutchDutch West IndianEastern EuropeanEcuadorianEgyptianEnglishEstonianEthiopianEuropeanFijianFilipinoFinnishFrenchFrench American IndianFrench CanadianGermanGerman RussianGhanaianGreekGuamanian/ChamorroGuatemalanGuyaneseHaitianHmongHonduranHopiHoumaHungarianIcelanderIndian (Asian)IndonesianInupiatIranianIraqiIrishIroquoisIsraeliItalianJamaicanJapaneseJordanianKenyanKiowaKoreanLaotianLatvianLebaneseLiberianLithuanianLumbeeLuxembourgerMacedonianMalaysianMalteseMarshalleseMenomineeMexicanMexican American IndianMongolianMoroccanNative HawaiianNavajoNepaleseNew ZealanderNicaraguanNigerianNorthern EuropeanNorwegianOkinawanOsageOttawaPaiutePakistaniPalestinianPanamanianParaguayanPennsylvania GermanPeruvianPimaPolishPortuguesePotawatomiPuebloPuerto RicanPuget Sound SalishRomanianRussianSalvadoranSamoanScandinavianScotch-IrishScottishSeminoleSenegaleseSerbianShoshoneSierra LeoneanSiouxSlavicSlovakSloveneSomaliSouth AfricanSouth AmericanSouth American IndianSoviet UnionSpaniardSpanishSpanish AmericanSpanish American IndianSri LankanSubsaharan AfricanSudaneseSwedishSwissSyrianTaiwaneseThaiTlingit-HaidaTohono O'OdhamTonganTrinidadian and TobagonianTsimshianTurkishU.S. Virgin IslanderUgandanUkrainianUruguayanUteVenezuelanVietnameseWelshWest IndianYakamaYaquiYugoslavianYumanYup'ikZimbabwean
Immigration
NonimmigrantsImmigrantsAfghanistanAfricaAlbaniaArgentinaArmeniaAsiaAustraliaAustriaBahamasBangladeshBarbadosBelarusBelgiumBelizeBosnia and HerzegovinaBrazilBulgariaBurma/MyanmarCabo VerdeCambodiaCameroonCanadaCaribbeanCentral AmericaChileChinaColombiaCongoCosta RicaCroatiaCubaCzechoslovakiaDenmarkDominicaDominican RepublicEastern AfricaEastern AsiaEastern EuropeEcuadorEgyptEl SalvadorEnglandEritreaEthiopiaEuropeFijiFranceGermanyGhanaGreeceGrenadaGuatemalaGuyanaHaitiHondurasHong KongHungaryIndiaIndonesiaIranIraqIrelandIsraelItalyJamaicaJapanJordanKazakhstanKenyaKoreaKuwaitLaosLatin AmericaLatviaLebanonLiberiaLithuaniaMalaysiaMexicoMicronesiaMiddle AfricaMoldovaMoroccoNepalNetherlandsNicaraguaNigeriaNorth AmericaNorth MacedoniaNorthern AfricaNorthern EuropeNorwayOceaniaPakistanPanamaPeruPhilippinesPolandPortugalRomaniaRussiaSaudi ArabiaScotlandSenegalSerbiaSierra LeoneSingaporeSomaliaSouth AfricaSouth AmericaSouth Central AsiaSouth Eastern AsiaSouthern EuropeSpainSri LankaSt. Vincent and the GrenadinesSudanSwedenSwitzerlandSyriaTaiwanThailandTrinidad and TobagoTurkeyUgandaUkraineUruguayUzbekistanVenezuelaVietnamWest IndiesWestern AfricaWestern AsiaWestern EuropeYemenZaireZimbabweAzores
Immigrants from Bolivia
Race
Ancestry
AfghanAfricanAlaska NativeAlaskan AthabascanAlbanianAleutAlsatianAmericanApacheArabArapahoArgentineanArmenianAssyrian/Chaldean/SyriacAustralianAustrianBahamianBangladeshiBarbadianBasqueBelgianBelizeanBermudanBhutaneseBlackfeetBolivianBrazilianBritishBritish West IndianBulgarianBurmeseCajunCambodianCanadianCape VerdeanCarpatho RusynCelticCentral AmericanCentral American IndianCherokeeCheyenneChickasawChileanChineseChippewaChoctawColombianColvilleComancheCosta RicanCreeCreekCroatianCrowCubanCypriotCzechCzechoslovakianDanishDelawareDominicanDutchDutch West IndianEastern EuropeanEcuadorianEgyptianEnglishEstonianEthiopianEuropeanFijianFilipinoFinnishFrenchFrench American IndianFrench CanadianGermanGerman RussianGhanaianGreekGuamanian/ChamorroGuatemalanGuyaneseHaitianHmongHonduranHopiHoumaHungarianIcelanderIndian (Asian)IndonesianInupiatIranianIraqiIrishIroquoisIsraeliItalianJamaicanJapaneseJordanianKenyanKiowaKoreanLaotianLatvianLebaneseLiberianLithuanianLumbeeLuxembourgerMacedonianMalaysianMalteseMarshalleseMenomineeMexicanMexican American IndianMongolianMoroccanNative HawaiianNavajoNepaleseNew ZealanderNicaraguanNigerianNorthern EuropeanNorwegianOkinawanOsageOttawaPaiutePakistaniPalestinianPanamanianParaguayanPennsylvania GermanPeruvianPimaPolishPortuguesePotawatomiPuebloPuerto RicanPuget Sound SalishRomanianRussianSalvadoranSamoanScandinavianScotch-IrishScottishSeminoleSenegaleseSerbianShoshoneSierra LeoneanSiouxSlavicSlovakSloveneSomaliSouth AfricanSouth AmericanSouth American IndianSoviet UnionSpaniardSpanishSpanish AmericanSpanish American IndianSri LankanSubsaharan AfricanSudaneseSwedishSwissSyrianTaiwaneseThaiTlingit-HaidaTohono O'OdhamTonganTrinidadian and TobagonianTsimshianTurkishU.S. Virgin IslanderUgandanUruguayanUteVenezuelanVietnameseWelshWest IndianYakamaYaquiYugoslavianYumanYup'ikZimbabwean
Immigration
NonimmigrantsImmigrantsAfghanistanAfricaAlbaniaArgentinaArmeniaAsiaAustraliaAustriaBahamasBangladeshBarbadosBelarusBelgiumBelizeBoliviaBosnia and HerzegovinaBrazilBulgariaBurma/MyanmarCabo VerdeCambodiaCameroonCanadaCaribbeanCentral AmericaChileChinaColombiaCongoCosta RicaCroatiaCubaCzechoslovakiaDenmarkDominicaDominican RepublicEastern AfricaEastern AsiaEastern EuropeEcuadorEgyptEl SalvadorEnglandEritreaEthiopiaEuropeFijiFranceGermanyGhanaGreeceGrenadaGuatemalaGuyanaHaitiHondurasHong KongHungaryIndiaIndonesiaIranIraqIrelandIsraelItalyJamaicaJapanJordanKazakhstanKenyaKoreaKuwaitLaosLatin AmericaLatviaLebanonLiberiaLithuaniaMalaysiaMexicoMicronesiaMiddle AfricaMoldovaMoroccoNepalNetherlandsNicaraguaNigeriaNorth AmericaNorth MacedoniaNorthern AfricaNorthern EuropeNorwayOceaniaPakistanPanamaPeruPhilippinesPolandPortugalRomaniaRussiaSaudi ArabiaScotlandSenegalSerbiaSierra LeoneSingaporeSomaliaSouth AfricaSouth AmericaSouth Central AsiaSouth Eastern AsiaSouthern EuropeSpainSri LankaSt. Vincent and the GrenadinesSudanSwedenSwitzerlandSyriaTaiwanThailandTrinidad and TobagoTurkeyUgandaUkraineUruguayUzbekistanVenezuelaVietnamWest IndiesWestern AfricaWestern AsiaWestern EuropeYemenZaireZimbabweAzores
Master's Degree
Income
Poverty
Unemployment
Labor Participation
Family Structure
Vehicle Availability
Education Level
Disability

Master's Degree Comparison

Ukrainians

Immigrants from Bolivia

Exceptional
Exceptional
16.9%
MASTER'S DEGREE
98.3/ 100
METRIC RATING
104th/ 347
METRIC RANK
19.1%
MASTER'S DEGREE
100.0/ 100
METRIC RATING
40th/ 347
METRIC RANK

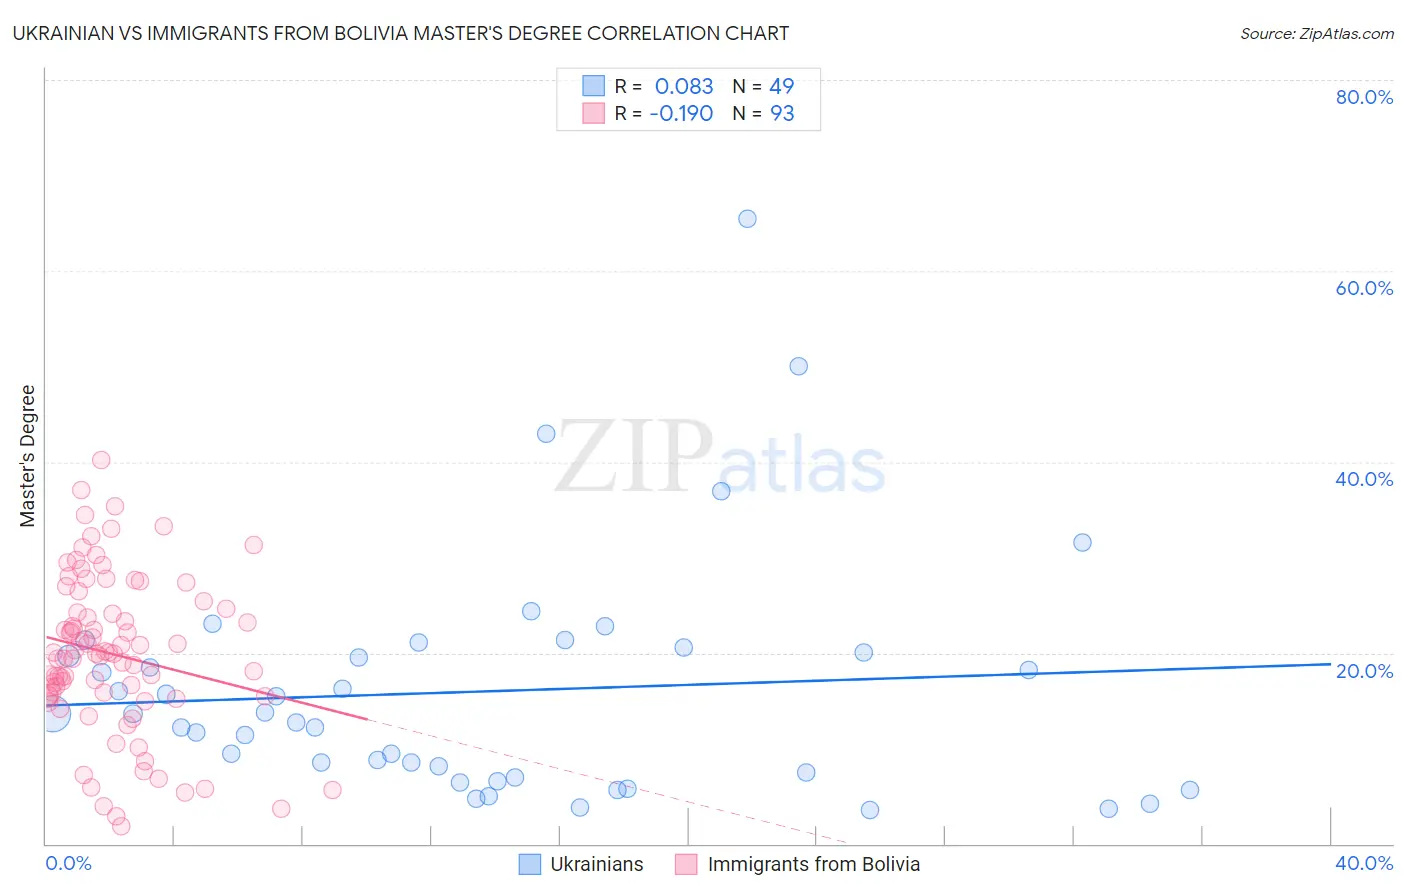
Ukrainian vs Immigrants from Bolivia Master's Degree Correlation Chart

The statistical analysis conducted on geographies consisting of 448,518,691 people shows a slight positive correlation between the proportion of Ukrainians and percentage of population with at least master's degree education in the United States with a correlation coefficient (R) of 0.083 and weighted average of 16.9%. Similarly, the statistical analysis conducted on geographies consisting of 158,724,078 people shows a poor negative correlation between the proportion of Immigrants from Bolivia and percentage of population with at least master's degree education in the United States with a correlation coefficient (R) of -0.190 and weighted average of 19.1%, a difference of 13.4%.
Ukrainian vs Immigrants from Bolivia Master's Degree

Master's Degree Correlation Summary

MeasurementUkrainianImmigrants from Bolivia
Minimum3.6%1.9%
Maximum65.5%40.2%
Range61.9%38.3%
Mean16.0%19.9%
Median13.6%19.9%
Interquartile 25% (IQ1)7.2%15.5%
Interquartile 75% (IQ3)20.3%25.0%
Interquartile Range (IQR)13.1%9.5%
Standard Deviation (Sample)12.3%8.2%
Standard Deviation (Population)12.2%8.2%

Similar Demographics by Master's Degree

Demographics Similar to Ukrainians by Master's Degree

In terms of master's degree, the demographic groups most similar to Ukrainians are Syrian (16.8%, a difference of 0.10%), Alsatian (16.9%, a difference of 0.12%), Immigrants from Albania (16.8%, a difference of 0.38%), Chilean (16.9%, a difference of 0.45%), and Armenian (16.8%, a difference of 0.47%).
DemographicsRating | RankMaster's Degree
Immigrants | England
98.8
/100
|
#97
Exceptional
17.0%
Immigrants | Ukraine
98.8
/100
|
#98
Exceptional
17.0%
Laotians
98.8
/100
|
#99
Exceptional
17.0%
Albanians
98.7
/100
|
#100
Exceptional
17.0%
Immigrants | Nepal
98.6
/100
|
#101
Exceptional
17.0%
Chileans
98.6
/100
|
#102
Exceptional
16.9%
Alsatians
98.4
/100
|
#103
Exceptional
16.9%
Ukrainians
98.3
/100
|
#104
Exceptional
16.9%
Syrians
98.3
/100
|
#105
Exceptional
16.8%
Immigrants | Albania
98.1
/100
|
#106
Exceptional
16.8%
Armenians
98.0
/100
|
#107
Exceptional
16.8%
Sierra Leoneans
98.0
/100
|
#108
Exceptional
16.8%
Moroccans
98.0
/100
|
#109
Exceptional
16.8%
Immigrants | Chile
98.0
/100
|
#110
Exceptional
16.8%
Austrians
97.8
/100
|
#111
Exceptional
16.7%

Demographics Similar to Immigrants from Bolivia by Master's Degree

In terms of master's degree, the demographic groups most similar to Immigrants from Bolivia are Immigrants from Spain (19.1%, a difference of 0.13%), Immigrants from Latvia (19.1%, a difference of 0.35%), Bolivian (19.3%, a difference of 0.77%), Immigrants from Saudi Arabia (19.0%, a difference of 0.78%), and Immigrants from Greece (19.0%, a difference of 0.79%).
DemographicsRating | RankMaster's Degree
Russians
100.0
/100
|
#33
Exceptional
19.5%
Immigrants | Denmark
100.0
/100
|
#34
Exceptional
19.5%
Immigrants | Northern Europe
100.0
/100
|
#35
Exceptional
19.5%
Immigrants | Russia
100.0
/100
|
#36
Exceptional
19.4%
Mongolians
100.0
/100
|
#37
Exceptional
19.4%
Bolivians
100.0
/100
|
#38
Exceptional
19.3%
Immigrants | Spain
100.0
/100
|
#39
Exceptional
19.1%
Immigrants | Bolivia
100.0
/100
|
#40
Exceptional
19.1%
Immigrants | Latvia
100.0
/100
|
#41
Exceptional
19.1%
Immigrants | Saudi Arabia
100.0
/100
|
#42
Exceptional
19.0%
Immigrants | Greece
100.0
/100
|
#43
Exceptional
19.0%
Immigrants | Malaysia
100.0
/100
|
#44
Exceptional
18.9%
Immigrants | Belarus
100.0
/100
|
#45
Exceptional
18.9%
Immigrants | Norway
100.0
/100
|
#46
Exceptional
18.8%
Immigrants | Austria
100.0
/100
|
#47
Exceptional
18.8%