Haitian vs Immigrants from Bolivia Master's Degree

COMPARE

Haitian
Race
Ancestry
AfghanAfricanAlaska NativeAlaskan AthabascanAlbanianAleutAlsatianAmericanApacheArabArapahoArgentineanArmenianAssyrian/Chaldean/SyriacAustralianAustrianBahamianBangladeshiBarbadianBasqueBelgianBelizeanBermudanBhutaneseBlackfeetBolivianBrazilianBritishBritish West IndianBulgarianBurmeseCajunCambodianCanadianCape VerdeanCarpatho RusynCelticCentral AmericanCentral American IndianCherokeeCheyenneChickasawChileanChineseChippewaChoctawColombianColvilleComancheCosta RicanCreeCreekCroatianCrowCubanCypriotCzechCzechoslovakianDanishDelawareDominicanDutchDutch West IndianEastern EuropeanEcuadorianEgyptianEnglishEstonianEthiopianEuropeanFijianFilipinoFinnishFrenchFrench American IndianFrench CanadianGermanGerman RussianGhanaianGreekGuamanian/ChamorroGuatemalanGuyaneseHaitianHmongHonduranHopiHoumaHungarianIcelanderIndian (Asian)IndonesianInupiatIranianIraqiIrishIroquoisIsraeliItalianJamaicanJapaneseJordanianKenyanKiowaKoreanLaotianLatvianLebaneseLiberianLithuanianLumbeeLuxembourgerMacedonianMalaysianMalteseMarshalleseMenomineeMexicanMexican American IndianMongolianMoroccanNative HawaiianNavajoNepaleseNew ZealanderNicaraguanNigerianNorthern EuropeanNorwegianOkinawanOsageOttawaPaiutePakistaniPalestinianPanamanianParaguayanPennsylvania GermanPeruvianPimaPolishPortuguesePotawatomiPuebloPuerto RicanPuget Sound SalishRomanianRussianSalvadoranSamoanScandinavianScotch-IrishScottishSeminoleSenegaleseSerbianShoshoneSierra LeoneanSiouxSlavicSlovakSloveneSomaliSouth AfricanSouth AmericanSouth American IndianSoviet UnionSpaniardSpanishSpanish AmericanSpanish American IndianSri LankanSubsaharan AfricanSudaneseSwedishSwissSyrianTaiwaneseThaiTlingit-HaidaTohono O'OdhamTonganTrinidadian and TobagonianTsimshianTurkishU.S. Virgin IslanderUgandanUkrainianUruguayanUteVenezuelanVietnameseWelshWest IndianYakamaYaquiYugoslavianYumanYup'ikZimbabwean
Immigration
NonimmigrantsImmigrantsAfghanistanAfricaAlbaniaArgentinaArmeniaAsiaAustraliaAustriaBahamasBangladeshBarbadosBelarusBelgiumBelizeBosnia and HerzegovinaBrazilBulgariaBurma/MyanmarCabo VerdeCambodiaCameroonCanadaCaribbeanCentral AmericaChileChinaColombiaCongoCosta RicaCroatiaCubaCzechoslovakiaDenmarkDominicaDominican RepublicEastern AfricaEastern AsiaEastern EuropeEcuadorEgyptEl SalvadorEnglandEritreaEthiopiaEuropeFijiFranceGermanyGhanaGreeceGrenadaGuatemalaGuyanaHaitiHondurasHong KongHungaryIndiaIndonesiaIranIraqIrelandIsraelItalyJamaicaJapanJordanKazakhstanKenyaKoreaKuwaitLaosLatin AmericaLatviaLebanonLiberiaLithuaniaMalaysiaMexicoMicronesiaMiddle AfricaMoldovaMoroccoNepalNetherlandsNicaraguaNigeriaNorth AmericaNorth MacedoniaNorthern AfricaNorthern EuropeNorwayOceaniaPakistanPanamaPeruPhilippinesPolandPortugalRomaniaRussiaSaudi ArabiaScotlandSenegalSerbiaSierra LeoneSingaporeSomaliaSouth AfricaSouth AmericaSouth Central AsiaSouth Eastern AsiaSouthern EuropeSpainSri LankaSt. Vincent and the GrenadinesSudanSwedenSwitzerlandSyriaTaiwanThailandTrinidad and TobagoTurkeyUgandaUkraineUruguayUzbekistanVenezuelaVietnamWest IndiesWestern AfricaWestern AsiaWestern EuropeYemenZaireZimbabweAzores
Immigrants from Bolivia
Race
Ancestry
AfghanAfricanAlaska NativeAlaskan AthabascanAlbanianAleutAlsatianAmericanApacheArabArapahoArgentineanArmenianAssyrian/Chaldean/SyriacAustralianAustrianBahamianBangladeshiBarbadianBasqueBelgianBelizeanBermudanBhutaneseBlackfeetBolivianBrazilianBritishBritish West IndianBulgarianBurmeseCajunCambodianCanadianCape VerdeanCarpatho RusynCelticCentral AmericanCentral American IndianCherokeeCheyenneChickasawChileanChineseChippewaChoctawColombianColvilleComancheCosta RicanCreeCreekCroatianCrowCubanCypriotCzechCzechoslovakianDanishDelawareDominicanDutchDutch West IndianEastern EuropeanEcuadorianEgyptianEnglishEstonianEthiopianEuropeanFijianFilipinoFinnishFrenchFrench American IndianFrench CanadianGermanGerman RussianGhanaianGreekGuamanian/ChamorroGuatemalanGuyaneseHmongHonduranHopiHoumaHungarianIcelanderIndian (Asian)IndonesianInupiatIranianIraqiIrishIroquoisIsraeliItalianJamaicanJapaneseJordanianKenyanKiowaKoreanLaotianLatvianLebaneseLiberianLithuanianLumbeeLuxembourgerMacedonianMalaysianMalteseMarshalleseMenomineeMexicanMexican American IndianMongolianMoroccanNative HawaiianNavajoNepaleseNew ZealanderNicaraguanNigerianNorthern EuropeanNorwegianOkinawanOsageOttawaPaiutePakistaniPalestinianPanamanianParaguayanPennsylvania GermanPeruvianPimaPolishPortuguesePotawatomiPuebloPuerto RicanPuget Sound SalishRomanianRussianSalvadoranSamoanScandinavianScotch-IrishScottishSeminoleSenegaleseSerbianShoshoneSierra LeoneanSiouxSlavicSlovakSloveneSomaliSouth AfricanSouth AmericanSouth American IndianSoviet UnionSpaniardSpanishSpanish AmericanSpanish American IndianSri LankanSubsaharan AfricanSudaneseSwedishSwissSyrianTaiwaneseThaiTlingit-HaidaTohono O'OdhamTonganTrinidadian and TobagonianTsimshianTurkishU.S. Virgin IslanderUgandanUkrainianUruguayanUteVenezuelanVietnameseWelshWest IndianYakamaYaquiYugoslavianYumanYup'ikZimbabwean
Immigration
NonimmigrantsImmigrantsAfghanistanAfricaAlbaniaArgentinaArmeniaAsiaAustraliaAustriaBahamasBangladeshBarbadosBelarusBelgiumBelizeBoliviaBosnia and HerzegovinaBrazilBulgariaBurma/MyanmarCabo VerdeCambodiaCameroonCanadaCaribbeanCentral AmericaChileChinaColombiaCongoCosta RicaCroatiaCubaCzechoslovakiaDenmarkDominicaDominican RepublicEastern AfricaEastern AsiaEastern EuropeEcuadorEgyptEl SalvadorEnglandEritreaEthiopiaEuropeFijiFranceGermanyGhanaGreeceGrenadaGuatemalaGuyanaHaitiHondurasHong KongHungaryIndiaIndonesiaIranIraqIrelandIsraelItalyJamaicaJapanJordanKazakhstanKenyaKoreaKuwaitLaosLatin AmericaLatviaLebanonLiberiaLithuaniaMalaysiaMexicoMicronesiaMiddle AfricaMoldovaMoroccoNepalNetherlandsNicaraguaNigeriaNorth AmericaNorth MacedoniaNorthern AfricaNorthern EuropeNorwayOceaniaPakistanPanamaPeruPhilippinesPolandPortugalRomaniaRussiaSaudi ArabiaScotlandSenegalSerbiaSierra LeoneSingaporeSomaliaSouth AfricaSouth AmericaSouth Central AsiaSouth Eastern AsiaSouthern EuropeSpainSri LankaSt. Vincent and the GrenadinesSudanSwedenSwitzerlandSyriaTaiwanThailandTrinidad and TobagoTurkeyUgandaUkraineUruguayUzbekistanVenezuelaVietnamWest IndiesWestern AfricaWestern AsiaWestern EuropeYemenZaireZimbabweAzores
Master's Degree
Income
Poverty
Unemployment
Labor Participation
Family Structure
Vehicle Availability
Education Level
Disability

Master's Degree Comparison

Haitians

Immigrants from Bolivia

Tragic
Exceptional
12.1%
MASTER'S DEGREE
0.3/ 100
METRIC RATING
271st/ 347
METRIC RANK
19.1%
MASTER'S DEGREE
100.0/ 100
METRIC RATING
40th/ 347
METRIC RANK

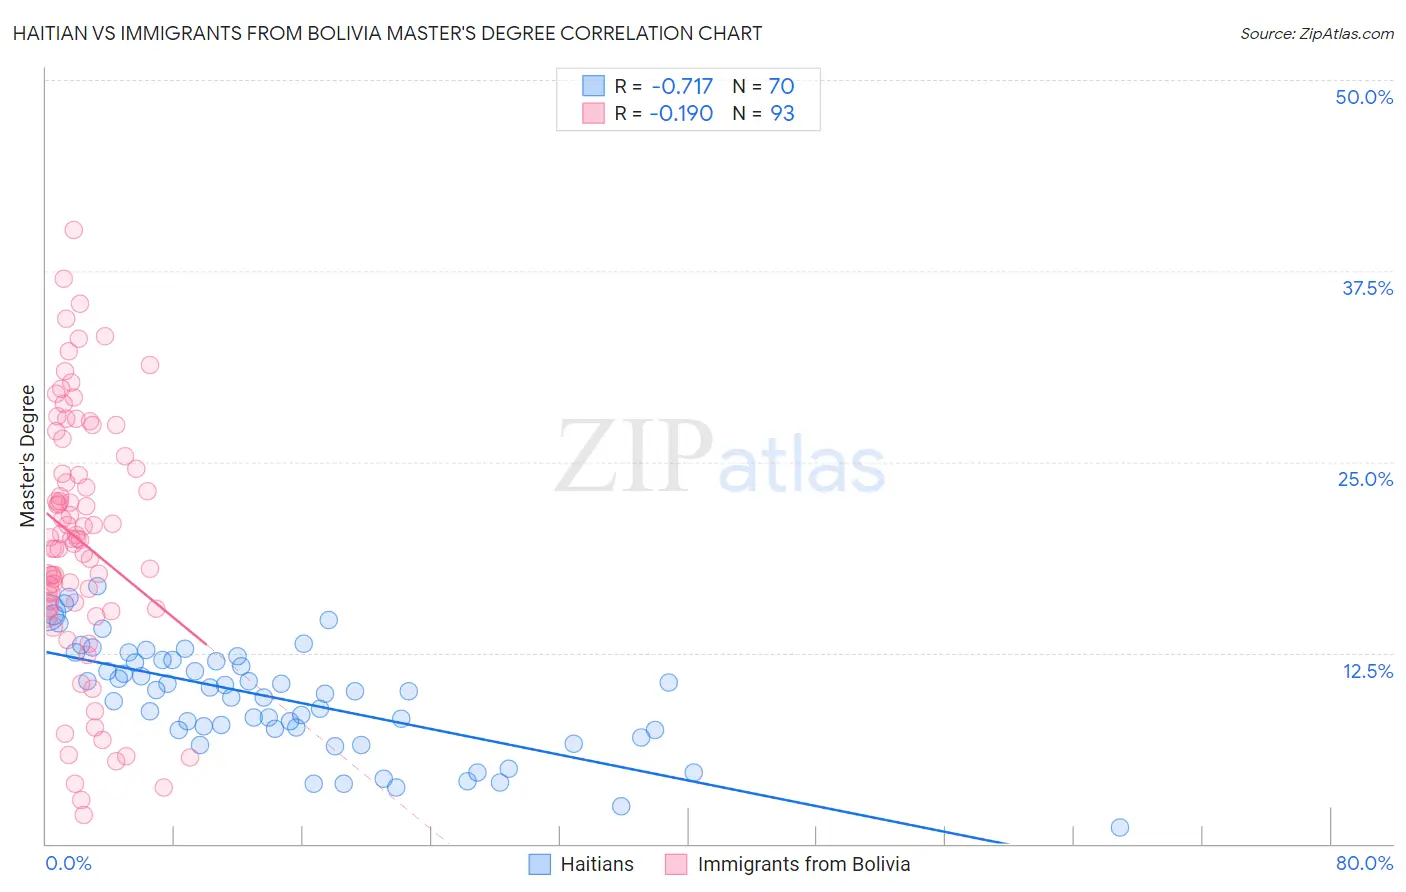
Haitian vs Immigrants from Bolivia Master's Degree Correlation Chart

The statistical analysis conducted on geographies consisting of 287,849,817 people shows a strong negative correlation between the proportion of Haitians and percentage of population with at least master's degree education in the United States with a correlation coefficient (R) of -0.717 and weighted average of 12.1%. Similarly, the statistical analysis conducted on geographies consisting of 158,724,078 people shows a poor negative correlation between the proportion of Immigrants from Bolivia and percentage of population with at least master's degree education in the United States with a correlation coefficient (R) of -0.190 and weighted average of 19.1%, a difference of 57.9%.
Haitian vs Immigrants from Bolivia Master's Degree

Master's Degree Correlation Summary

MeasurementHaitianImmigrants from Bolivia
Minimum1.1%1.9%
Maximum16.9%40.2%
Range15.8%38.3%
Mean9.5%19.9%
Median10.0%19.9%
Interquartile 25% (IQ1)7.5%15.5%
Interquartile 75% (IQ3)12.0%25.0%
Interquartile Range (IQR)4.6%9.5%
Standard Deviation (Sample)3.5%8.2%
Standard Deviation (Population)3.5%8.2%

Similar Demographics by Master's Degree

Demographics Similar to Haitians by Master's Degree

In terms of master's degree, the demographic groups most similar to Haitians are Comanche (12.1%, a difference of 0.060%), Blackfeet (12.1%, a difference of 0.15%), Cape Verdean (12.1%, a difference of 0.24%), Cuban (12.1%, a difference of 0.25%), and Black/African American (12.1%, a difference of 0.31%).
DemographicsRating | RankMaster's Degree
Belizeans
0.5
/100
|
#264
Tragic
12.4%
Immigrants | Fiji
0.5
/100
|
#265
Tragic
12.4%
Bahamians
0.5
/100
|
#266
Tragic
12.4%
Americans
0.4
/100
|
#267
Tragic
12.3%
Native Hawaiians
0.4
/100
|
#268
Tragic
12.3%
Central Americans
0.3
/100
|
#269
Tragic
12.2%
Salvadorans
0.3
/100
|
#270
Tragic
12.2%
Haitians
0.3
/100
|
#271
Tragic
12.1%
Comanche
0.3
/100
|
#272
Tragic
12.1%
Blackfeet
0.3
/100
|
#273
Tragic
12.1%
Cape Verdeans
0.3
/100
|
#274
Tragic
12.1%
Cubans
0.3
/100
|
#275
Tragic
12.1%
Blacks/African Americans
0.3
/100
|
#276
Tragic
12.1%
Immigrants | Caribbean
0.3
/100
|
#277
Tragic
12.1%
Potawatomi
0.3
/100
|
#278
Tragic
12.1%

Demographics Similar to Immigrants from Bolivia by Master's Degree

In terms of master's degree, the demographic groups most similar to Immigrants from Bolivia are Immigrants from Spain (19.1%, a difference of 0.13%), Immigrants from Latvia (19.1%, a difference of 0.35%), Bolivian (19.3%, a difference of 0.77%), Immigrants from Saudi Arabia (19.0%, a difference of 0.78%), and Immigrants from Greece (19.0%, a difference of 0.79%).
DemographicsRating | RankMaster's Degree
Russians
100.0
/100
|
#33
Exceptional
19.5%
Immigrants | Denmark
100.0
/100
|
#34
Exceptional
19.5%
Immigrants | Northern Europe
100.0
/100
|
#35
Exceptional
19.5%
Immigrants | Russia
100.0
/100
|
#36
Exceptional
19.4%
Mongolians
100.0
/100
|
#37
Exceptional
19.4%
Bolivians
100.0
/100
|
#38
Exceptional
19.3%
Immigrants | Spain
100.0
/100
|
#39
Exceptional
19.1%
Immigrants | Bolivia
100.0
/100
|
#40
Exceptional
19.1%
Immigrants | Latvia
100.0
/100
|
#41
Exceptional
19.1%
Immigrants | Saudi Arabia
100.0
/100
|
#42
Exceptional
19.0%
Immigrants | Greece
100.0
/100
|
#43
Exceptional
19.0%
Immigrants | Malaysia
100.0
/100
|
#44
Exceptional
18.9%
Immigrants | Belarus
100.0
/100
|
#45
Exceptional
18.9%
Immigrants | Norway
100.0
/100
|
#46
Exceptional
18.8%
Immigrants | Austria
100.0
/100
|
#47
Exceptional
18.8%