Tongan vs Immigrants from Latin America Doctorate Degree
COMPARE
Tongan
Immigrants from Latin America
Doctorate Degree
Doctorate Degree Comparison
Tongans
Immigrants from Latin America
1.7%
DOCTORATE DEGREE
15.1/ 100
METRIC RATING
210th/ 347
METRIC RANK
1.3%
DOCTORATE DEGREE
0.0/ 100
METRIC RATING
331st/ 347
METRIC RANK
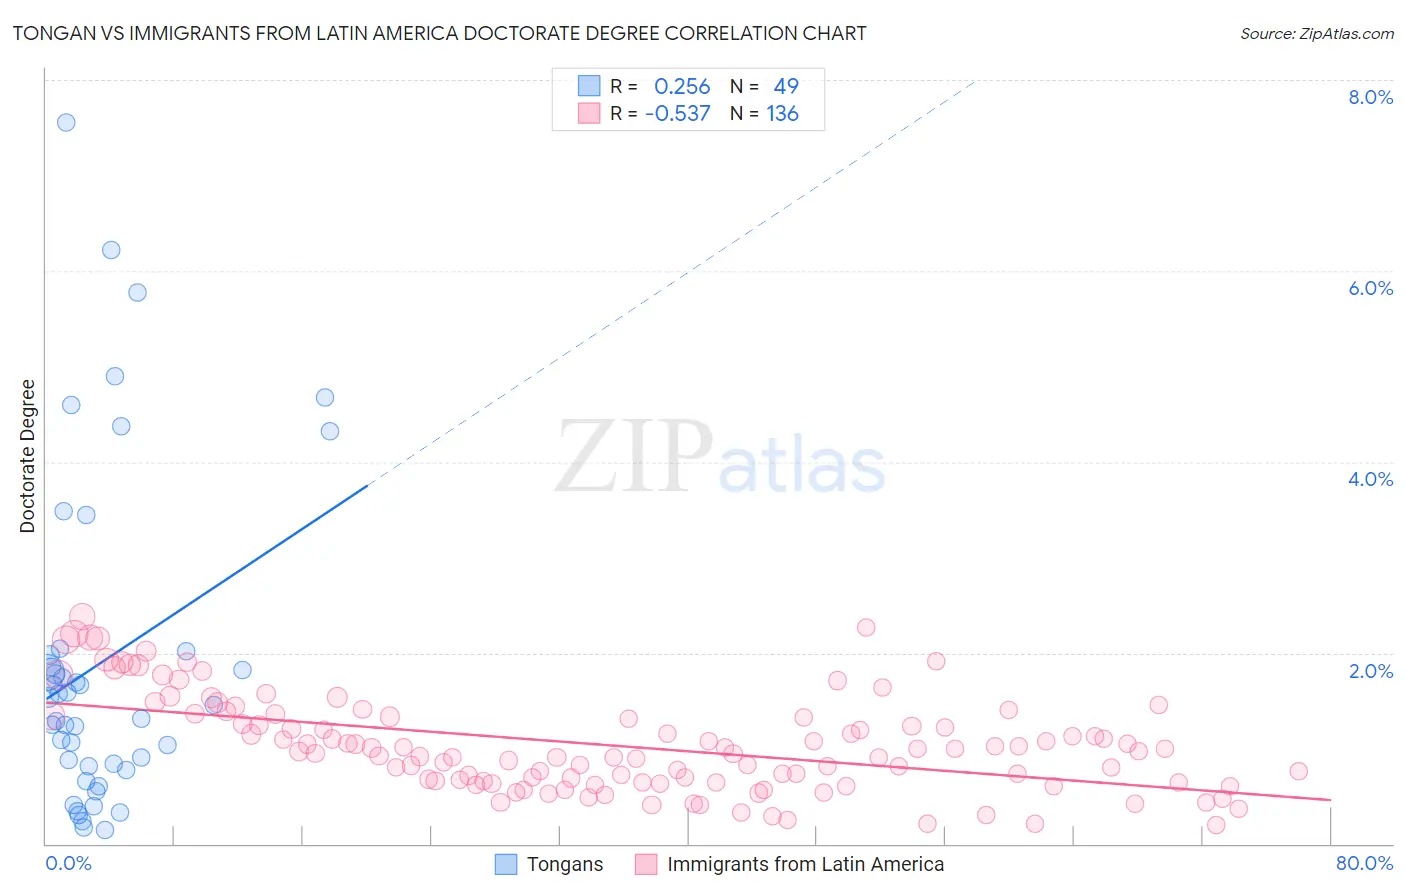
Tongan vs Immigrants from Latin America Doctorate Degree Correlation Chart
The statistical analysis conducted on geographies consisting of 102,428,868 people shows a weak positive correlation between the proportion of Tongans and percentage of population with at least doctorate degree education in the United States with a correlation coefficient (R) of 0.256 and weighted average of 1.7%. Similarly, the statistical analysis conducted on geographies consisting of 538,199,058 people shows a substantial negative correlation between the proportion of Immigrants from Latin America and percentage of population with at least doctorate degree education in the United States with a correlation coefficient (R) of -0.537 and weighted average of 1.3%, a difference of 32.2%.
Doctorate Degree Correlation Summary
| Measurement | Tongan | Immigrants from Latin America |
| Minimum | 0.15% | 0.19% |
| Maximum | 7.5% | 2.4% |
| Range | 7.4% | 2.2% |
| Mean | 1.9% | 1.0% |
| Median | 1.4% | 0.97% |
| Interquartile 25% (IQ1) | 0.79% | 0.65% |
| Interquartile 75% (IQ3) | 2.0% | 1.3% |
| Interquartile Range (IQR) | 1.2% | 0.68% |
| Standard Deviation (Sample) | 1.7% | 0.50% |
| Standard Deviation (Population) | 1.7% | 0.50% |
Similar Demographics by Doctorate Degree
Demographics Similar to Tongans by Doctorate Degree
In terms of doctorate degree, the demographic groups most similar to Tongans are Immigrants from Armenia (1.7%, a difference of 0.010%), Immigrants from Western Africa (1.7%, a difference of 0.080%), Immigrants from South Eastern Asia (1.7%, a difference of 0.14%), Colombian (1.7%, a difference of 0.27%), and Korean (1.7%, a difference of 0.29%).
| Demographics | Rating | Rank | Doctorate Degree |
| Immigrants | Vietnam | 21.4 /100 | #203 | Fair 1.8% |
| Somalis | 21.2 /100 | #204 | Fair 1.7% |
| Venezuelans | 19.5 /100 | #205 | Poor 1.7% |
| Immigrants | Peru | 17.6 /100 | #206 | Poor 1.7% |
| Yugoslavians | 17.1 /100 | #207 | Poor 1.7% |
| Colombians | 16.1 /100 | #208 | Poor 1.7% |
| Immigrants | Western Africa | 15.4 /100 | #209 | Poor 1.7% |
| Tongans | 15.1 /100 | #210 | Poor 1.7% |
| Immigrants | Armenia | 15.1 /100 | #211 | Poor 1.7% |
| Immigrants | South Eastern Asia | 14.7 /100 | #212 | Poor 1.7% |
| Koreans | 14.2 /100 | #213 | Poor 1.7% |
| Pueblo | 14.2 /100 | #214 | Poor 1.7% |
| Alaskan Athabascans | 13.8 /100 | #215 | Poor 1.7% |
| Immigrants | Burma/Myanmar | 13.5 /100 | #216 | Poor 1.7% |
| Spanish Americans | 12.9 /100 | #217 | Poor 1.7% |
Demographics Similar to Immigrants from Latin America by Doctorate Degree
In terms of doctorate degree, the demographic groups most similar to Immigrants from Latin America are Yup'ik (1.3%, a difference of 0.010%), Haitian (1.3%, a difference of 0.23%), Inupiat (1.3%, a difference of 0.28%), Hispanic or Latino (1.3%, a difference of 0.86%), and Immigrants from Cabo Verde (1.3%, a difference of 1.1%).
| Demographics | Rating | Rank | Doctorate Degree |
| Natives/Alaskans | 0.0 /100 | #324 | Tragic 1.3% |
| Pima | 0.0 /100 | #325 | Tragic 1.3% |
| Immigrants | Cabo Verde | 0.0 /100 | #326 | Tragic 1.3% |
| Hispanics or Latinos | 0.0 /100 | #327 | Tragic 1.3% |
| Inupiat | 0.0 /100 | #328 | Tragic 1.3% |
| Haitians | 0.0 /100 | #329 | Tragic 1.3% |
| Yup'ik | 0.0 /100 | #330 | Tragic 1.3% |
| Immigrants | Latin America | 0.0 /100 | #331 | Tragic 1.3% |
| Yakama | 0.0 /100 | #332 | Tragic 1.3% |
| Immigrants | Caribbean | 0.0 /100 | #333 | Tragic 1.3% |
| Immigrants | Dominican Republic | 0.0 /100 | #334 | Tragic 1.3% |
| Immigrants | Haiti | 0.0 /100 | #335 | Tragic 1.3% |
| Nepalese | 0.0 /100 | #336 | Tragic 1.3% |
| Bangladeshis | 0.0 /100 | #337 | Tragic 1.2% |
| Puget Sound Salish | 0.0 /100 | #338 | Tragic 1.2% |