Immigrants from Jordan vs Immigrants from Latin America Doctorate Degree
COMPARE
Immigrants from Jordan
Immigrants from Latin America
Doctorate Degree
Doctorate Degree Comparison
Immigrants from Jordan
Immigrants from Latin America
2.0%
DOCTORATE DEGREE
94.8/ 100
METRIC RATING
121st/ 347
METRIC RANK
1.3%
DOCTORATE DEGREE
0.0/ 100
METRIC RATING
331st/ 347
METRIC RANK
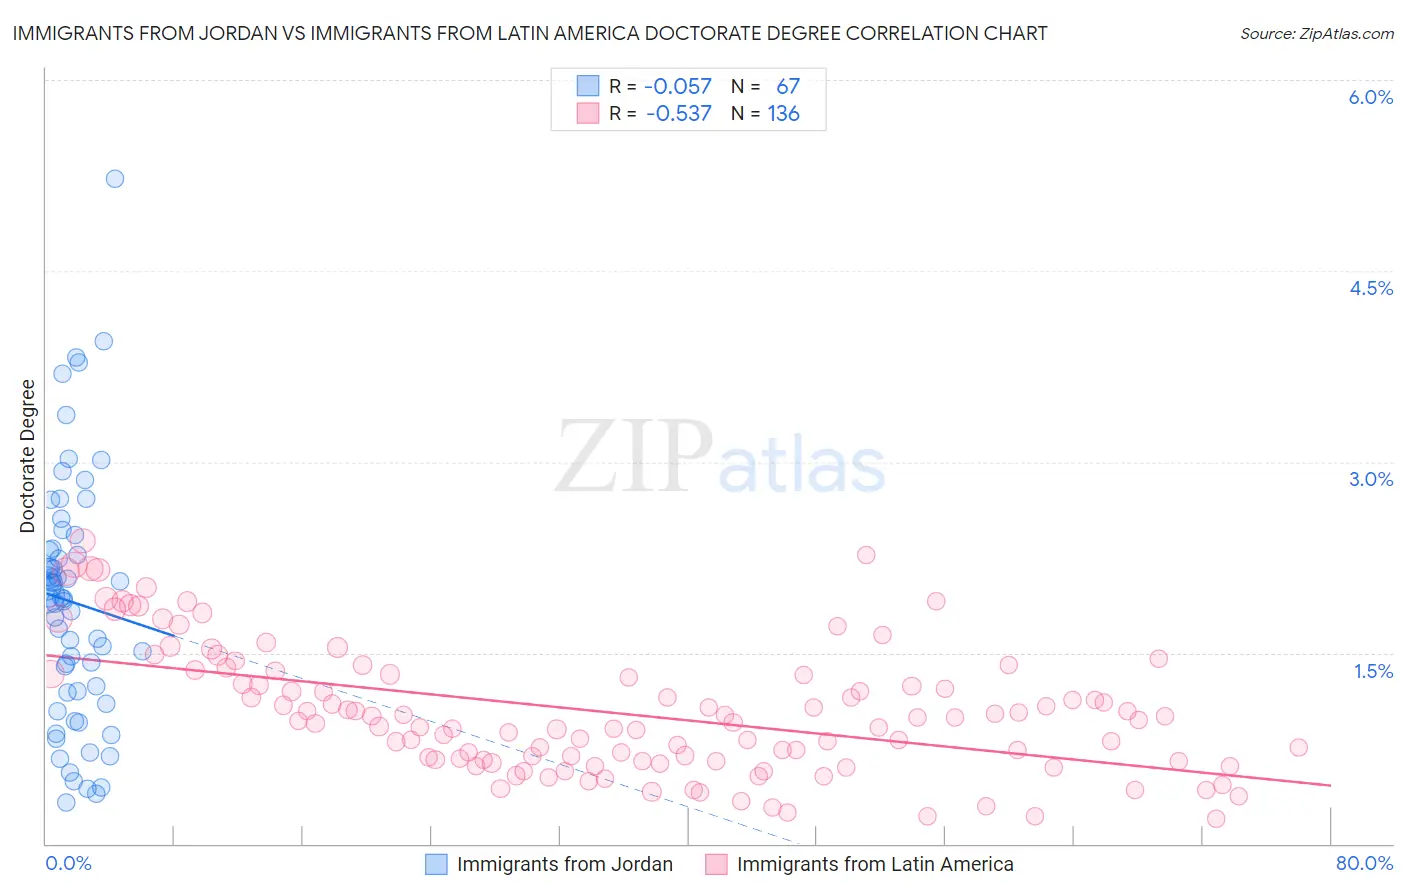
Immigrants from Jordan vs Immigrants from Latin America Doctorate Degree Correlation Chart
The statistical analysis conducted on geographies consisting of 180,883,250 people shows a slight negative correlation between the proportion of Immigrants from Jordan and percentage of population with at least doctorate degree education in the United States with a correlation coefficient (R) of -0.057 and weighted average of 2.0%. Similarly, the statistical analysis conducted on geographies consisting of 538,199,058 people shows a substantial negative correlation between the proportion of Immigrants from Latin America and percentage of population with at least doctorate degree education in the United States with a correlation coefficient (R) of -0.537 and weighted average of 1.3%, a difference of 56.0%.
Doctorate Degree Correlation Summary
| Measurement | Immigrants from Jordan | Immigrants from Latin America |
| Minimum | 0.32% | 0.19% |
| Maximum | 5.2% | 2.4% |
| Range | 4.9% | 2.2% |
| Mean | 1.9% | 1.0% |
| Median | 1.9% | 0.97% |
| Interquartile 25% (IQ1) | 1.2% | 0.65% |
| Interquartile 75% (IQ3) | 2.3% | 1.3% |
| Interquartile Range (IQR) | 1.1% | 0.68% |
| Standard Deviation (Sample) | 0.98% | 0.50% |
| Standard Deviation (Population) | 0.97% | 0.50% |
Similar Demographics by Doctorate Degree
Demographics Similar to Immigrants from Jordan by Doctorate Degree
In terms of doctorate degree, the demographic groups most similar to Immigrants from Jordan are Immigrants from Southern Europe (2.0%, a difference of 0.030%), Immigrants from Morocco (2.0%, a difference of 0.48%), Croatian (2.0%, a difference of 0.48%), Pakistani (2.0%, a difference of 0.76%), and Icelander (2.1%, a difference of 0.90%).
| Demographics | Rating | Rank | Doctorate Degree |
| Immigrants | Croatia | 96.8 /100 | #114 | Exceptional 2.1% |
| Taiwanese | 96.7 /100 | #115 | Exceptional 2.1% |
| Maltese | 96.2 /100 | #116 | Exceptional 2.1% |
| Lebanese | 96.0 /100 | #117 | Exceptional 2.1% |
| Icelanders | 96.0 /100 | #118 | Exceptional 2.1% |
| Pakistanis | 95.8 /100 | #119 | Exceptional 2.0% |
| Immigrants | Morocco | 95.5 /100 | #120 | Exceptional 2.0% |
| Immigrants | Jordan | 94.8 /100 | #121 | Exceptional 2.0% |
| Immigrants | Southern Europe | 94.7 /100 | #122 | Exceptional 2.0% |
| Croatians | 94.0 /100 | #123 | Exceptional 2.0% |
| Ute | 93.2 /100 | #124 | Exceptional 2.0% |
| Moroccans | 93.0 /100 | #125 | Exceptional 2.0% |
| Jordanians | 92.1 /100 | #126 | Exceptional 2.0% |
| Palestinians | 92.0 /100 | #127 | Exceptional 2.0% |
| Immigrants | Zaire | 91.1 /100 | #128 | Exceptional 2.0% |
Demographics Similar to Immigrants from Latin America by Doctorate Degree
In terms of doctorate degree, the demographic groups most similar to Immigrants from Latin America are Yup'ik (1.3%, a difference of 0.010%), Haitian (1.3%, a difference of 0.23%), Inupiat (1.3%, a difference of 0.28%), Hispanic or Latino (1.3%, a difference of 0.86%), and Immigrants from Cabo Verde (1.3%, a difference of 1.1%).
| Demographics | Rating | Rank | Doctorate Degree |
| Natives/Alaskans | 0.0 /100 | #324 | Tragic 1.3% |
| Pima | 0.0 /100 | #325 | Tragic 1.3% |
| Immigrants | Cabo Verde | 0.0 /100 | #326 | Tragic 1.3% |
| Hispanics or Latinos | 0.0 /100 | #327 | Tragic 1.3% |
| Inupiat | 0.0 /100 | #328 | Tragic 1.3% |
| Haitians | 0.0 /100 | #329 | Tragic 1.3% |
| Yup'ik | 0.0 /100 | #330 | Tragic 1.3% |
| Immigrants | Latin America | 0.0 /100 | #331 | Tragic 1.3% |
| Yakama | 0.0 /100 | #332 | Tragic 1.3% |
| Immigrants | Caribbean | 0.0 /100 | #333 | Tragic 1.3% |
| Immigrants | Dominican Republic | 0.0 /100 | #334 | Tragic 1.3% |
| Immigrants | Haiti | 0.0 /100 | #335 | Tragic 1.3% |
| Nepalese | 0.0 /100 | #336 | Tragic 1.3% |
| Bangladeshis | 0.0 /100 | #337 | Tragic 1.2% |
| Puget Sound Salish | 0.0 /100 | #338 | Tragic 1.2% |