Tohono O'odham vs Israeli 2nd Grade

COMPARE

Tohono O'odham
Race
Ancestry
AfghanAfricanAlaska NativeAlaskan AthabascanAlbanianAleutAlsatianAmericanApacheArabArapahoArgentineanArmenianAssyrian/Chaldean/SyriacAustralianAustrianBahamianBangladeshiBarbadianBasqueBelgianBelizeanBermudanBhutaneseBlackfeetBolivianBrazilianBritishBritish West IndianBulgarianBurmeseCajunCambodianCanadianCape VerdeanCarpatho RusynCelticCentral AmericanCentral American IndianCherokeeCheyenneChickasawChileanChineseChippewaChoctawColombianColvilleComancheCosta RicanCreeCreekCroatianCrowCubanCypriotCzechCzechoslovakianDanishDelawareDominicanDutchDutch West IndianEastern EuropeanEcuadorianEgyptianEnglishEstonianEthiopianEuropeanFijianFilipinoFinnishFrenchFrench American IndianFrench CanadianGermanGerman RussianGhanaianGreekGuamanian/ChamorroGuatemalanGuyaneseHaitianHmongHonduranHopiHoumaHungarianIcelanderIndian (Asian)IndonesianInupiatIranianIraqiIrishIroquoisItalianJamaicanJapaneseJordanianKenyanKiowaKoreanLaotianLatvianLebaneseLiberianLithuanianLumbeeLuxembourgerMacedonianMalaysianMalteseMarshalleseMenomineeMexicanMexican American IndianMongolianMoroccanNative HawaiianNavajoNepaleseNew ZealanderNicaraguanNigerianNorthern EuropeanNorwegianOkinawanOsageOttawaPaiutePakistaniPalestinianPanamanianParaguayanPennsylvania GermanPeruvianPimaPolishPortuguesePotawatomiPuebloPuerto RicanPuget Sound SalishRomanianRussianSalvadoranSamoanScandinavianScotch-IrishScottishSeminoleSenegaleseSerbianShoshoneSierra LeoneanSiouxSlavicSlovakSloveneSomaliSouth AfricanSouth AmericanSouth American IndianSoviet UnionSpaniardSpanishSpanish AmericanSpanish American IndianSri LankanSubsaharan AfricanSudaneseSwedishSwissSyrianTaiwaneseThaiTlingit-HaidaTohono O'OdhamTonganTrinidadian and TobagonianTsimshianTurkishU.S. Virgin IslanderUgandanUkrainianUruguayanUteVenezuelanVietnameseWelshWest IndianYakamaYaquiYugoslavianYumanYup'ikZimbabwean
Immigration
NonimmigrantsImmigrantsAfghanistanAfricaAlbaniaArgentinaArmeniaAsiaAustraliaAustriaBahamasBangladeshBarbadosBelarusBelgiumBelizeBoliviaBosnia and HerzegovinaBrazilBulgariaBurma/MyanmarCabo VerdeCambodiaCameroonCanadaCaribbeanCentral AmericaChileChinaColombiaCongoCosta RicaCroatiaCubaCzechoslovakiaDenmarkDominicaDominican RepublicEastern AfricaEastern AsiaEastern EuropeEcuadorEgyptEl SalvadorEnglandEritreaEthiopiaEuropeFijiFranceGermanyGhanaGreeceGrenadaGuatemalaGuyanaHaitiHondurasHong KongHungaryIndiaIndonesiaIranIraqIrelandIsraelItalyJamaicaJapanJordanKazakhstanKenyaKoreaKuwaitLaosLatin AmericaLatviaLebanonLiberiaLithuaniaMalaysiaMexicoMicronesiaMiddle AfricaMoldovaMoroccoNepalNetherlandsNicaraguaNigeriaNorth AmericaNorth MacedoniaNorthern AfricaNorthern EuropeNorwayOceaniaPakistanPanamaPeruPhilippinesPolandPortugalRomaniaRussiaSaudi ArabiaScotlandSenegalSerbiaSierra LeoneSingaporeSomaliaSouth AfricaSouth AmericaSouth Central AsiaSouth Eastern AsiaSouthern EuropeSpainSri LankaSt. Vincent and the GrenadinesSudanSwedenSwitzerlandSyriaTaiwanThailandTrinidad and TobagoTurkeyUgandaUkraineUruguayUzbekistanVenezuelaVietnamWest IndiesWestern AfricaWestern AsiaWestern EuropeYemenZaireZimbabweAzores
Israeli
Race
Ancestry
AfghanAfricanAlaska NativeAlaskan AthabascanAlbanianAleutAlsatianAmericanApacheArabArapahoArgentineanArmenianAssyrian/Chaldean/SyriacAustralianAustrianBahamianBangladeshiBarbadianBasqueBelgianBelizeanBermudanBhutaneseBlackfeetBolivianBrazilianBritishBritish West IndianBulgarianBurmeseCajunCambodianCanadianCape VerdeanCarpatho RusynCelticCentral AmericanCentral American IndianCherokeeCheyenneChickasawChileanChineseChippewaChoctawColombianColvilleComancheCosta RicanCreeCreekCroatianCrowCubanCypriotCzechCzechoslovakianDanishDelawareDominicanDutchDutch West IndianEastern EuropeanEcuadorianEgyptianEnglishEstonianEthiopianEuropeanFijianFilipinoFinnishFrenchFrench American IndianFrench CanadianGermanGerman RussianGhanaianGreekGuamanian/ChamorroGuatemalanGuyaneseHaitianHmongHonduranHopiHoumaHungarianIcelanderIndian (Asian)IndonesianInupiatIranianIraqiIrishIroquoisIsraeliItalianJamaicanJapaneseJordanianKenyanKiowaKoreanLaotianLatvianLebaneseLiberianLithuanianLumbeeLuxembourgerMacedonianMalaysianMalteseMarshalleseMenomineeMexicanMexican American IndianMongolianMoroccanNative HawaiianNavajoNepaleseNew ZealanderNicaraguanNigerianNorthern EuropeanNorwegianOkinawanOsageOttawaPaiutePakistaniPalestinianPanamanianParaguayanPennsylvania GermanPeruvianPimaPolishPortuguesePotawatomiPuebloPuerto RicanPuget Sound SalishRomanianRussianSalvadoranSamoanScandinavianScotch-IrishScottishSeminoleSenegaleseSerbianShoshoneSierra LeoneanSiouxSlavicSlovakSloveneSomaliSouth AfricanSouth AmericanSouth American IndianSoviet UnionSpaniardSpanishSpanish AmericanSpanish American IndianSri LankanSubsaharan AfricanSudaneseSwedishSwissSyrianTaiwaneseThaiTlingit-HaidaTonganTrinidadian and TobagonianTsimshianTurkishU.S. Virgin IslanderUgandanUkrainianUruguayanUteVenezuelanVietnameseWelshWest IndianYakamaYaquiYugoslavianYumanYup'ikZimbabwean
Immigration
NonimmigrantsImmigrantsAfghanistanAfricaAlbaniaArgentinaArmeniaAsiaAustraliaAustriaBahamasBangladeshBarbadosBelarusBelgiumBelizeBoliviaBosnia and HerzegovinaBrazilBulgariaBurma/MyanmarCabo VerdeCambodiaCameroonCanadaCaribbeanCentral AmericaChileChinaColombiaCongoCosta RicaCroatiaCubaCzechoslovakiaDenmarkDominicaDominican RepublicEastern AfricaEastern AsiaEastern EuropeEcuadorEgyptEl SalvadorEnglandEritreaEthiopiaEuropeFijiFranceGermanyGhanaGreeceGrenadaGuatemalaGuyanaHaitiHondurasHong KongHungaryIndiaIndonesiaIranIraqIrelandIsraelItalyJamaicaJapanJordanKazakhstanKenyaKoreaKuwaitLaosLatin AmericaLatviaLebanonLiberiaLithuaniaMalaysiaMexicoMicronesiaMiddle AfricaMoldovaMoroccoNepalNetherlandsNicaraguaNigeriaNorth AmericaNorth MacedoniaNorthern AfricaNorthern EuropeNorwayOceaniaPakistanPanamaPeruPhilippinesPolandPortugalRomaniaRussiaSaudi ArabiaScotlandSenegalSerbiaSierra LeoneSingaporeSomaliaSouth AfricaSouth AmericaSouth Central AsiaSouth Eastern AsiaSouthern EuropeSpainSri LankaSt. Vincent and the GrenadinesSudanSwedenSwitzerlandSyriaTaiwanThailandTrinidad and TobagoTurkeyUgandaUkraineUruguayUzbekistanVenezuelaVietnamWest IndiesWestern AfricaWestern AsiaWestern EuropeYemenZaireZimbabweAzores
2nd Grade
Income
Poverty
Unemployment
Labor Participation
Family Structure
Vehicle Availability
Education Level
Disability

2nd Grade Comparison

Tohono O'odham

Israelis

Fair
Excellent
97.8%
2ND GRADE
20.9/ 100
METRIC RATING
201st/ 347
METRIC RANK
98.0%
2ND GRADE
87.9/ 100
METRIC RATING
138th/ 347
METRIC RANK

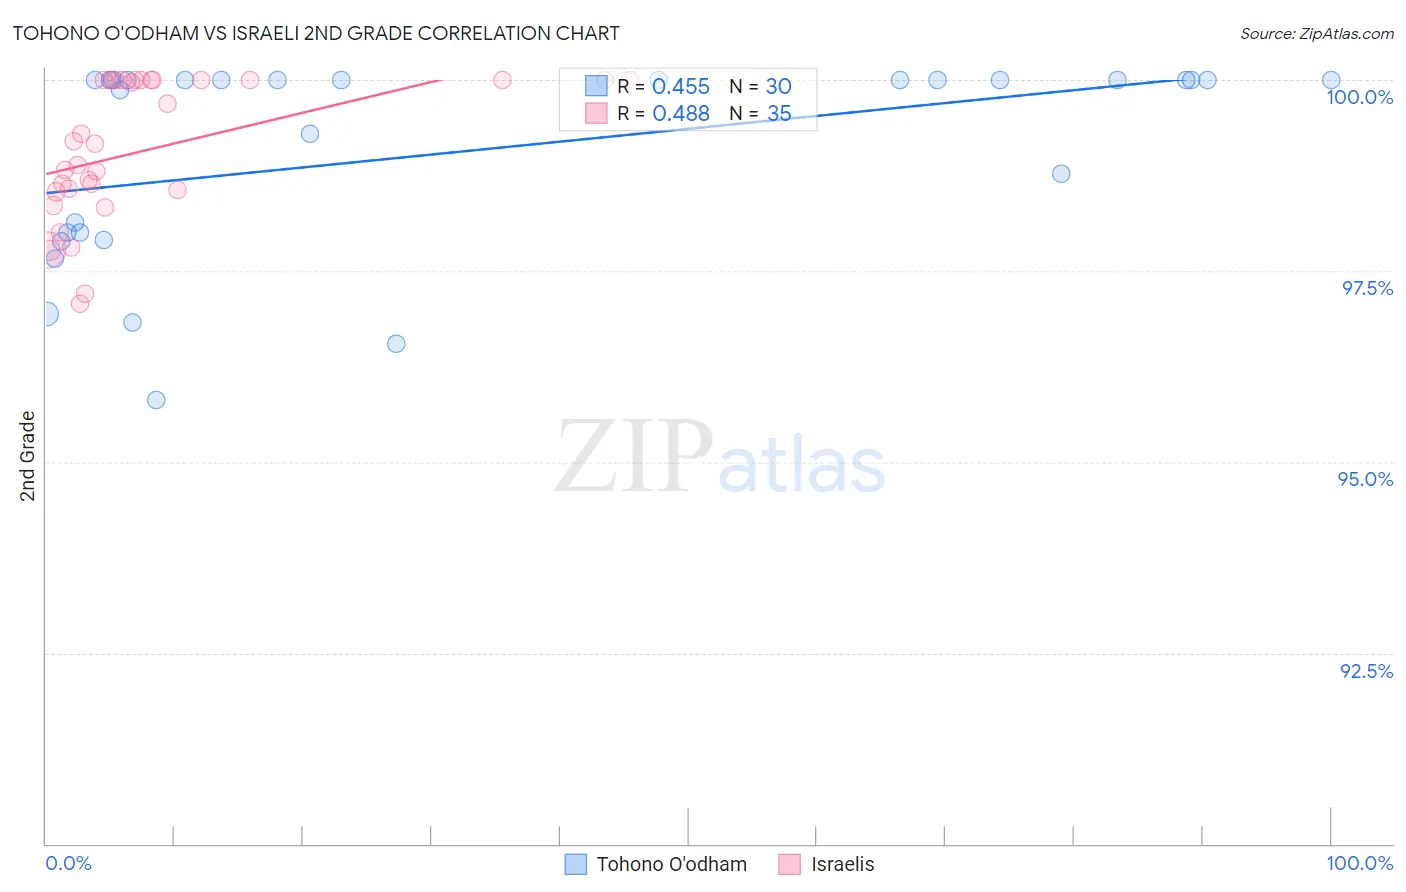
Tohono O'odham vs Israeli 2nd Grade Correlation Chart

The statistical analysis conducted on geographies consisting of 58,723,100 people shows a moderate positive correlation between the proportion of Tohono O'odham and percentage of population with at least 2nd grade education in the United States with a correlation coefficient (R) of 0.455 and weighted average of 97.8%. Similarly, the statistical analysis conducted on geographies consisting of 211,219,690 people shows a moderate positive correlation between the proportion of Israelis and percentage of population with at least 2nd grade education in the United States with a correlation coefficient (R) of 0.488 and weighted average of 98.0%, a difference of 0.26%.
Tohono O'odham vs Israeli 2nd Grade

2nd Grade Correlation Summary

MeasurementTohono O'odhamIsraeli
Minimum95.8%97.1%
Maximum100.0%100.0%
Range4.2%2.9%
Mean99.1%99.1%
Median100.0%99.2%
Interquartile 25% (IQ1)98.0%98.5%
Interquartile 75% (IQ3)100.0%100.0%
Interquartile Range (IQR)2.0%1.5%
Standard Deviation (Sample)1.3%0.92%
Standard Deviation (Population)1.3%0.90%

Similar Demographics by 2nd Grade

Demographics Similar to Tohono O'odham by 2nd Grade

In terms of 2nd grade, the demographic groups most similar to Tohono O'odham are Immigrants from Lebanon (97.8%, a difference of 0.0%), Immigrants from Ukraine (97.8%, a difference of 0.0%), Yuman (97.8%, a difference of 0.0%), Immigrants from Albania (97.8%, a difference of 0.010%), and Immigrants from Southern Europe (97.8%, a difference of 0.010%).
DemographicsRating | Rank2nd Grade
Paiute
27.0
/100
|
#194
Fair
97.8%
Mongolians
26.7
/100
|
#195
Fair
97.8%
Immigrants | Kenya
26.4
/100
|
#196
Fair
97.8%
Immigrants | Uganda
26.3
/100
|
#197
Fair
97.8%
Guamanians/Chamorros
25.7
/100
|
#198
Fair
97.8%
Immigrants | Egypt
24.4
/100
|
#199
Fair
97.8%
Immigrants | Lebanon
20.9
/100
|
#200
Fair
97.8%
Tohono O'odham
20.9
/100
|
#201
Fair
97.8%
Immigrants | Ukraine
20.5
/100
|
#202
Fair
97.8%
Yuman
20.0
/100
|
#203
Fair
97.8%
Immigrants | Albania
18.4
/100
|
#204
Poor
97.8%
Immigrants | Southern Europe
18.1
/100
|
#205
Poor
97.8%
Immigrants | Chile
17.3
/100
|
#206
Poor
97.7%
Africans
15.6
/100
|
#207
Poor
97.7%
Immigrants | Northern Africa
12.3
/100
|
#208
Poor
97.7%

Demographics Similar to Israelis by 2nd Grade

In terms of 2nd grade, the demographic groups most similar to Israelis are Immigrants from Romania (98.0%, a difference of 0.0%), Blackfeet (98.0%, a difference of 0.0%), Immigrants from Hungary (98.0%, a difference of 0.010%), Immigrants from Bulgaria (98.0%, a difference of 0.010%), and Immigrants from Kuwait (98.0%, a difference of 0.010%).
DemographicsRating | Rank2nd Grade
Immigrants | Europe
91.1
/100
|
#131
Exceptional
98.0%
Spaniards
90.7
/100
|
#132
Exceptional
98.0%
Cambodians
90.7
/100
|
#133
Exceptional
98.0%
Immigrants | Hungary
89.7
/100
|
#134
Excellent
98.0%
Immigrants | Bulgaria
89.7
/100
|
#135
Excellent
98.0%
Immigrants | Kuwait
89.2
/100
|
#136
Excellent
98.0%
Immigrants | Romania
88.3
/100
|
#137
Excellent
98.0%
Israelis
87.9
/100
|
#138
Excellent
98.0%
Blackfeet
87.5
/100
|
#139
Excellent
98.0%
Palestinians
83.9
/100
|
#140
Excellent
98.0%
Immigrants | Turkey
83.0
/100
|
#141
Excellent
98.0%
Burmese
81.0
/100
|
#142
Excellent
98.0%
Alsatians
80.5
/100
|
#143
Excellent
98.0%
Hmong
80.0
/100
|
#144
Good
98.0%
Filipinos
79.2
/100
|
#145
Good
98.0%