Spanish American vs Israeli 2nd Grade

COMPARE

Spanish American
Race
Ancestry
AfghanAfricanAlaska NativeAlaskan AthabascanAlbanianAleutAlsatianAmericanApacheArabArapahoArgentineanArmenianAssyrian/Chaldean/SyriacAustralianAustrianBahamianBangladeshiBarbadianBasqueBelgianBelizeanBermudanBhutaneseBlackfeetBolivianBrazilianBritishBritish West IndianBulgarianBurmeseCajunCambodianCanadianCape VerdeanCarpatho RusynCelticCentral AmericanCentral American IndianCherokeeCheyenneChickasawChileanChineseChippewaChoctawColombianColvilleComancheCosta RicanCreeCreekCroatianCrowCubanCypriotCzechCzechoslovakianDanishDelawareDominicanDutchDutch West IndianEastern EuropeanEcuadorianEgyptianEnglishEstonianEthiopianEuropeanFijianFilipinoFinnishFrenchFrench American IndianFrench CanadianGermanGerman RussianGhanaianGreekGuamanian/ChamorroGuatemalanGuyaneseHaitianHmongHonduranHopiHoumaHungarianIcelanderIndian (Asian)IndonesianInupiatIranianIraqiIrishIroquoisItalianJamaicanJapaneseJordanianKenyanKiowaKoreanLaotianLatvianLebaneseLiberianLithuanianLumbeeLuxembourgerMacedonianMalaysianMalteseMarshalleseMenomineeMexicanMexican American IndianMongolianMoroccanNative HawaiianNavajoNepaleseNew ZealanderNicaraguanNigerianNorthern EuropeanNorwegianOkinawanOsageOttawaPaiutePakistaniPalestinianPanamanianParaguayanPennsylvania GermanPeruvianPimaPolishPortuguesePotawatomiPuebloPuerto RicanPuget Sound SalishRomanianRussianSalvadoranSamoanScandinavianScotch-IrishScottishSeminoleSenegaleseSerbianShoshoneSierra LeoneanSiouxSlavicSlovakSloveneSomaliSouth AfricanSouth AmericanSouth American IndianSoviet UnionSpaniardSpanishSpanish AmericanSpanish American IndianSri LankanSubsaharan AfricanSudaneseSwedishSwissSyrianTaiwaneseThaiTlingit-HaidaTohono O'OdhamTonganTrinidadian and TobagonianTsimshianTurkishU.S. Virgin IslanderUgandanUkrainianUruguayanUteVenezuelanVietnameseWelshWest IndianYakamaYaquiYugoslavianYumanYup'ikZimbabwean
Immigration
NonimmigrantsImmigrantsAfghanistanAfricaAlbaniaArgentinaArmeniaAsiaAustraliaAustriaBahamasBangladeshBarbadosBelarusBelgiumBelizeBoliviaBosnia and HerzegovinaBrazilBulgariaBurma/MyanmarCabo VerdeCambodiaCameroonCanadaCaribbeanCentral AmericaChileChinaColombiaCongoCosta RicaCroatiaCubaCzechoslovakiaDenmarkDominicaDominican RepublicEastern AfricaEastern AsiaEastern EuropeEcuadorEgyptEl SalvadorEnglandEritreaEthiopiaEuropeFijiFranceGermanyGhanaGreeceGrenadaGuatemalaGuyanaHaitiHondurasHong KongHungaryIndiaIndonesiaIranIraqIrelandIsraelItalyJamaicaJapanJordanKazakhstanKenyaKoreaKuwaitLaosLatin AmericaLatviaLebanonLiberiaLithuaniaMalaysiaMexicoMicronesiaMiddle AfricaMoldovaMoroccoNepalNetherlandsNicaraguaNigeriaNorth AmericaNorth MacedoniaNorthern AfricaNorthern EuropeNorwayOceaniaPakistanPanamaPeruPhilippinesPolandPortugalRomaniaRussiaSaudi ArabiaScotlandSenegalSerbiaSierra LeoneSingaporeSomaliaSouth AfricaSouth AmericaSouth Central AsiaSouth Eastern AsiaSouthern EuropeSpainSri LankaSt. Vincent and the GrenadinesSudanSwedenSwitzerlandSyriaTaiwanThailandTrinidad and TobagoTurkeyUgandaUkraineUruguayUzbekistanVenezuelaVietnamWest IndiesWestern AfricaWestern AsiaWestern EuropeYemenZaireZimbabweAzores
Israeli
Race
Ancestry
AfghanAfricanAlaska NativeAlaskan AthabascanAlbanianAleutAlsatianAmericanApacheArabArapahoArgentineanArmenianAssyrian/Chaldean/SyriacAustralianAustrianBahamianBangladeshiBarbadianBasqueBelgianBelizeanBermudanBhutaneseBlackfeetBolivianBrazilianBritishBritish West IndianBulgarianBurmeseCajunCambodianCanadianCape VerdeanCarpatho RusynCelticCentral AmericanCentral American IndianCherokeeCheyenneChickasawChileanChineseChippewaChoctawColombianColvilleComancheCosta RicanCreeCreekCroatianCrowCubanCypriotCzechCzechoslovakianDanishDelawareDominicanDutchDutch West IndianEastern EuropeanEcuadorianEgyptianEnglishEstonianEthiopianEuropeanFijianFilipinoFinnishFrenchFrench American IndianFrench CanadianGermanGerman RussianGhanaianGreekGuamanian/ChamorroGuatemalanGuyaneseHaitianHmongHonduranHopiHoumaHungarianIcelanderIndian (Asian)IndonesianInupiatIranianIraqiIrishIroquoisIsraeliItalianJamaicanJapaneseJordanianKenyanKiowaKoreanLaotianLatvianLebaneseLiberianLithuanianLumbeeLuxembourgerMacedonianMalaysianMalteseMarshalleseMenomineeMexicanMexican American IndianMongolianMoroccanNative HawaiianNavajoNepaleseNew ZealanderNicaraguanNigerianNorthern EuropeanNorwegianOkinawanOsageOttawaPaiutePakistaniPalestinianPanamanianParaguayanPennsylvania GermanPeruvianPimaPolishPortuguesePotawatomiPuebloPuerto RicanPuget Sound SalishRomanianRussianSalvadoranSamoanScandinavianScotch-IrishScottishSeminoleSenegaleseSerbianShoshoneSierra LeoneanSiouxSlavicSlovakSloveneSomaliSouth AfricanSouth AmericanSouth American IndianSoviet UnionSpaniardSpanishSpanish American IndianSri LankanSubsaharan AfricanSudaneseSwedishSwissSyrianTaiwaneseThaiTlingit-HaidaTohono O'OdhamTonganTrinidadian and TobagonianTsimshianTurkishU.S. Virgin IslanderUgandanUkrainianUruguayanUteVenezuelanVietnameseWelshWest IndianYakamaYaquiYugoslavianYumanYup'ikZimbabwean
Immigration
NonimmigrantsImmigrantsAfghanistanAfricaAlbaniaArgentinaArmeniaAsiaAustraliaAustriaBahamasBangladeshBarbadosBelarusBelgiumBelizeBoliviaBosnia and HerzegovinaBrazilBulgariaBurma/MyanmarCabo VerdeCambodiaCameroonCanadaCaribbeanCentral AmericaChileChinaColombiaCongoCosta RicaCroatiaCubaCzechoslovakiaDenmarkDominicaDominican RepublicEastern AfricaEastern AsiaEastern EuropeEcuadorEgyptEl SalvadorEnglandEritreaEthiopiaEuropeFijiFranceGermanyGhanaGreeceGrenadaGuatemalaGuyanaHaitiHondurasHong KongHungaryIndiaIndonesiaIranIraqIrelandIsraelItalyJamaicaJapanJordanKazakhstanKenyaKoreaKuwaitLaosLatin AmericaLatviaLebanonLiberiaLithuaniaMalaysiaMexicoMicronesiaMiddle AfricaMoldovaMoroccoNepalNetherlandsNicaraguaNigeriaNorth AmericaNorth MacedoniaNorthern AfricaNorthern EuropeNorwayOceaniaPakistanPanamaPeruPhilippinesPolandPortugalRomaniaRussiaSaudi ArabiaScotlandSenegalSerbiaSierra LeoneSingaporeSomaliaSouth AfricaSouth AmericaSouth Central AsiaSouth Eastern AsiaSouthern EuropeSpainSri LankaSt. Vincent and the GrenadinesSudanSwedenSwitzerlandSyriaTaiwanThailandTrinidad and TobagoTurkeyUgandaUkraineUruguayUzbekistanVenezuelaVietnamWest IndiesWestern AfricaWestern AsiaWestern EuropeYemenZaireZimbabweAzores
2nd Grade
Income
Poverty
Unemployment
Labor Participation
Family Structure
Vehicle Availability
Education Level
Disability

2nd Grade Comparison

Spanish Americans

Israelis

Average
Excellent
97.9%
2ND GRADE
56.4/ 100
METRIC RATING
165th/ 347
METRIC RANK
98.0%
2ND GRADE
87.9/ 100
METRIC RATING
138th/ 347
METRIC RANK

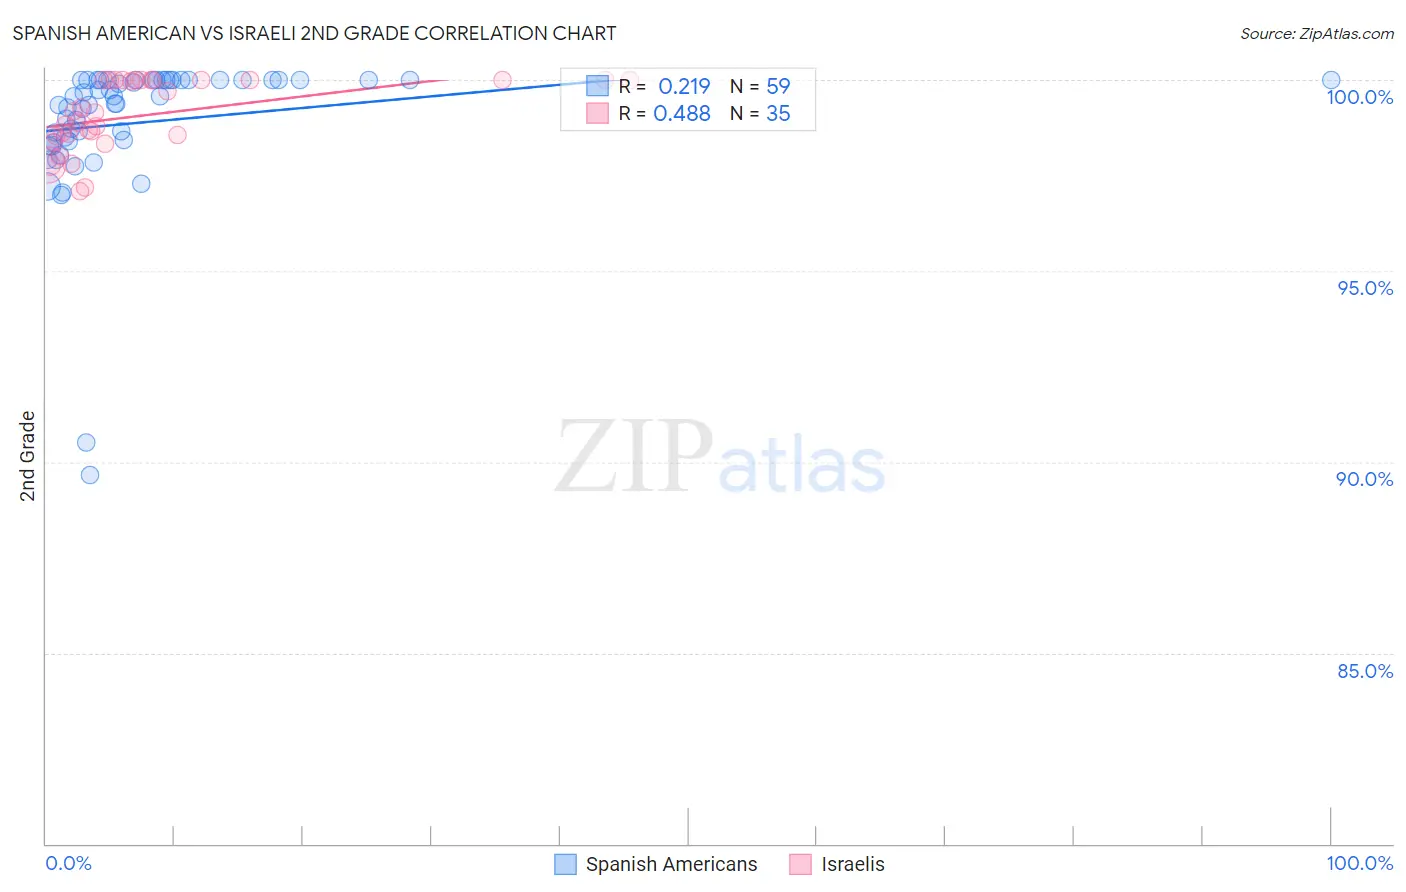
Spanish American vs Israeli 2nd Grade Correlation Chart

The statistical analysis conducted on geographies consisting of 103,168,542 people shows a weak positive correlation between the proportion of Spanish Americans and percentage of population with at least 2nd grade education in the United States with a correlation coefficient (R) of 0.219 and weighted average of 97.9%. Similarly, the statistical analysis conducted on geographies consisting of 211,219,690 people shows a moderate positive correlation between the proportion of Israelis and percentage of population with at least 2nd grade education in the United States with a correlation coefficient (R) of 0.488 and weighted average of 98.0%, a difference of 0.14%.
Spanish American vs Israeli 2nd Grade

2nd Grade Correlation Summary

MeasurementSpanish AmericanIsraeli
Minimum89.6%97.1%
Maximum100.0%100.0%
Range10.4%2.9%
Mean98.9%99.1%
Median99.6%99.2%
Interquartile 25% (IQ1)98.4%98.5%
Interquartile 75% (IQ3)100.0%100.0%
Interquartile Range (IQR)1.6%1.5%
Standard Deviation (Sample)1.9%0.92%
Standard Deviation (Population)1.9%0.90%

Similar Demographics by 2nd Grade

Demographics Similar to Spanish Americans by 2nd Grade

In terms of 2nd grade, the demographic groups most similar to Spanish Americans are Ugandan (97.9%, a difference of 0.0%), Immigrants from Jordan (97.9%, a difference of 0.0%), Chilean (97.9%, a difference of 0.0%), Brazilian (97.9%, a difference of 0.0%), and Immigrants from Spain (97.9%, a difference of 0.0%).
DemographicsRating | Rank2nd Grade
Immigrants | Iran
62.8
/100
|
#158
Good
97.9%
Comanche
62.8
/100
|
#159
Good
97.9%
Immigrants | Eastern Europe
61.1
/100
|
#160
Good
97.9%
Immigrants | Russia
60.3
/100
|
#161
Good
97.9%
Immigrants | Italy
60.2
/100
|
#162
Good
97.9%
Bermudans
59.4
/100
|
#163
Average
97.9%
Ugandans
56.6
/100
|
#164
Average
97.9%
Spanish Americans
56.4
/100
|
#165
Average
97.9%
Immigrants | Jordan
56.3
/100
|
#166
Average
97.9%
Chileans
56.1
/100
|
#167
Average
97.9%
Brazilians
55.8
/100
|
#168
Average
97.9%
Immigrants | Spain
55.4
/100
|
#169
Average
97.9%
Navajo
54.3
/100
|
#170
Average
97.9%
Albanians
52.8
/100
|
#171
Average
97.9%
Immigrants | Korea
52.7
/100
|
#172
Average
97.9%

Demographics Similar to Israelis by 2nd Grade

In terms of 2nd grade, the demographic groups most similar to Israelis are Immigrants from Romania (98.0%, a difference of 0.0%), Blackfeet (98.0%, a difference of 0.0%), Immigrants from Hungary (98.0%, a difference of 0.010%), Immigrants from Bulgaria (98.0%, a difference of 0.010%), and Immigrants from Kuwait (98.0%, a difference of 0.010%).
DemographicsRating | Rank2nd Grade
Immigrants | Europe
91.1
/100
|
#131
Exceptional
98.0%
Spaniards
90.7
/100
|
#132
Exceptional
98.0%
Cambodians
90.7
/100
|
#133
Exceptional
98.0%
Immigrants | Hungary
89.7
/100
|
#134
Excellent
98.0%
Immigrants | Bulgaria
89.7
/100
|
#135
Excellent
98.0%
Immigrants | Kuwait
89.2
/100
|
#136
Excellent
98.0%
Immigrants | Romania
88.3
/100
|
#137
Excellent
98.0%
Israelis
87.9
/100
|
#138
Excellent
98.0%
Blackfeet
87.5
/100
|
#139
Excellent
98.0%
Palestinians
83.9
/100
|
#140
Excellent
98.0%
Immigrants | Turkey
83.0
/100
|
#141
Excellent
98.0%
Burmese
81.0
/100
|
#142
Excellent
98.0%
Alsatians
80.5
/100
|
#143
Excellent
98.0%
Hmong
80.0
/100
|
#144
Good
98.0%
Filipinos
79.2
/100
|
#145
Good
98.0%