Spaniard vs Immigrants from Zaire 1st Grade

COMPARE

Spaniard
Race
Ancestry
AfghanAfricanAlaska NativeAlaskan AthabascanAlbanianAleutAlsatianAmericanApacheArabArapahoArgentineanArmenianAssyrian/Chaldean/SyriacAustralianAustrianBahamianBangladeshiBarbadianBasqueBelgianBelizeanBermudanBhutaneseBlackfeetBolivianBrazilianBritishBritish West IndianBulgarianBurmeseCajunCambodianCanadianCape VerdeanCarpatho RusynCelticCentral AmericanCentral American IndianCherokeeCheyenneChickasawChileanChineseChippewaChoctawColombianColvilleComancheCosta RicanCreeCreekCroatianCrowCubanCypriotCzechCzechoslovakianDanishDelawareDominicanDutchDutch West IndianEastern EuropeanEcuadorianEgyptianEnglishEstonianEthiopianEuropeanFijianFilipinoFinnishFrenchFrench American IndianFrench CanadianGermanGerman RussianGhanaianGreekGuamanian/ChamorroGuatemalanGuyaneseHaitianHmongHonduranHopiHoumaHungarianIcelanderIndian (Asian)IndonesianInupiatIranianIraqiIrishIroquoisIsraeliItalianJamaicanJapaneseJordanianKenyanKiowaKoreanLaotianLatvianLebaneseLiberianLithuanianLumbeeLuxembourgerMacedonianMalaysianMalteseMarshalleseMenomineeMexicanMexican American IndianMongolianMoroccanNative HawaiianNavajoNepaleseNew ZealanderNicaraguanNigerianNorthern EuropeanNorwegianOkinawanOsageOttawaPaiutePakistaniPalestinianPanamanianParaguayanPennsylvania GermanPeruvianPimaPolishPortuguesePotawatomiPuebloPuerto RicanPuget Sound SalishRomanianRussianSalvadoranSamoanScandinavianScotch-IrishScottishSeminoleSenegaleseSerbianShoshoneSierra LeoneanSiouxSlavicSlovakSloveneSomaliSouth AfricanSouth AmericanSouth American IndianSoviet UnionSpaniardSpanishSpanish AmericanSpanish American IndianSri LankanSubsaharan AfricanSudaneseSwedishSwissSyrianTaiwaneseThaiTlingit-HaidaTohono O'OdhamTonganTrinidadian and TobagonianTsimshianTurkishU.S. Virgin IslanderUgandanUkrainianUruguayanUteVenezuelanVietnameseWelshWest IndianYakamaYaquiYugoslavianYumanYup'ikZimbabwean
Immigration
NonimmigrantsImmigrantsAfghanistanAfricaAlbaniaArgentinaArmeniaAsiaAustraliaAustriaBahamasBangladeshBarbadosBelarusBelgiumBelizeBoliviaBosnia and HerzegovinaBrazilBulgariaBurma/MyanmarCabo VerdeCambodiaCameroonCanadaCaribbeanCentral AmericaChileChinaColombiaCongoCosta RicaCroatiaCubaCzechoslovakiaDenmarkDominicaDominican RepublicEastern AfricaEastern AsiaEastern EuropeEcuadorEgyptEl SalvadorEnglandEritreaEthiopiaEuropeFijiFranceGermanyGhanaGreeceGrenadaGuatemalaGuyanaHaitiHondurasHong KongHungaryIndiaIndonesiaIranIraqIrelandIsraelItalyJamaicaJapanJordanKazakhstanKenyaKoreaKuwaitLaosLatin AmericaLatviaLebanonLiberiaLithuaniaMalaysiaMexicoMicronesiaMiddle AfricaMoldovaMoroccoNepalNetherlandsNicaraguaNigeriaNorth AmericaNorth MacedoniaNorthern AfricaNorthern EuropeNorwayOceaniaPakistanPanamaPeruPhilippinesPolandPortugalRomaniaRussiaSaudi ArabiaScotlandSenegalSerbiaSierra LeoneSingaporeSomaliaSouth AfricaSouth AmericaSouth Central AsiaSouth Eastern AsiaSouthern EuropeSpainSri LankaSt. Vincent and the GrenadinesSudanSwedenSwitzerlandSyriaTaiwanThailandTrinidad and TobagoTurkeyUgandaUkraineUruguayUzbekistanVenezuelaVietnamWest IndiesWestern AfricaWestern AsiaWestern EuropeYemenZimbabweAzores
Immigrants from Zaire
Race
Ancestry
AfghanAfricanAlaska NativeAlaskan AthabascanAlbanianAleutAlsatianAmericanApacheArabArapahoArgentineanArmenianAssyrian/Chaldean/SyriacAustralianAustrianBahamianBangladeshiBarbadianBasqueBelgianBelizeanBermudanBhutaneseBlackfeetBolivianBrazilianBritishBritish West IndianBulgarianBurmeseCajunCambodianCanadianCape VerdeanCarpatho RusynCelticCentral AmericanCentral American IndianCherokeeCheyenneChickasawChileanChineseChippewaChoctawColombianColvilleComancheCosta RicanCreeCreekCroatianCrowCubanCypriotCzechCzechoslovakianDanishDelawareDominicanDutchDutch West IndianEastern EuropeanEcuadorianEgyptianEnglishEstonianEthiopianEuropeanFijianFilipinoFinnishFrenchFrench American IndianFrench CanadianGermanGerman RussianGhanaianGreekGuamanian/ChamorroGuatemalanGuyaneseHaitianHmongHonduranHopiHoumaHungarianIcelanderIndian (Asian)IndonesianInupiatIranianIraqiIrishIroquoisIsraeliItalianJamaicanJapaneseJordanianKenyanKiowaKoreanLaotianLatvianLebaneseLiberianLithuanianLumbeeLuxembourgerMacedonianMalaysianMalteseMarshalleseMenomineeMexicanMexican American IndianMongolianMoroccanNative HawaiianNavajoNepaleseNew ZealanderNicaraguanNigerianNorthern EuropeanNorwegianOkinawanOsageOttawaPaiutePakistaniPalestinianPanamanianParaguayanPennsylvania GermanPeruvianPimaPolishPortuguesePotawatomiPuebloPuerto RicanPuget Sound SalishRomanianRussianSalvadoranSamoanScandinavianScotch-IrishScottishSeminoleSenegaleseSerbianShoshoneSierra LeoneanSiouxSlavicSlovakSloveneSomaliSouth AfricanSouth AmericanSouth American IndianSoviet UnionSpanishSpanish AmericanSpanish American IndianSri LankanSubsaharan AfricanSudaneseSwedishSwissSyrianTaiwaneseThaiTlingit-HaidaTohono O'OdhamTonganTrinidadian and TobagonianTsimshianTurkishU.S. Virgin IslanderUgandanUkrainianUruguayanUteVenezuelanVietnameseWelshWest IndianYakamaYaquiYugoslavianYumanYup'ikZimbabwean
Immigration
NonimmigrantsImmigrantsAfghanistanAfricaAlbaniaArgentinaArmeniaAsiaAustraliaAustriaBahamasBangladeshBarbadosBelarusBelgiumBelizeBoliviaBosnia and HerzegovinaBrazilBulgariaBurma/MyanmarCabo VerdeCambodiaCameroonCanadaCaribbeanCentral AmericaChileChinaColombiaCongoCosta RicaCroatiaCubaCzechoslovakiaDenmarkDominicaDominican RepublicEastern AfricaEastern AsiaEastern EuropeEcuadorEgyptEl SalvadorEnglandEritreaEthiopiaEuropeFijiFranceGermanyGhanaGreeceGrenadaGuatemalaGuyanaHaitiHondurasHong KongHungaryIndiaIndonesiaIranIraqIrelandIsraelItalyJamaicaJapanJordanKazakhstanKenyaKoreaKuwaitLaosLatin AmericaLatviaLebanonLiberiaLithuaniaMalaysiaMexicoMicronesiaMiddle AfricaMoldovaMoroccoNepalNetherlandsNicaraguaNigeriaNorth AmericaNorth MacedoniaNorthern AfricaNorthern EuropeNorwayOceaniaPakistanPanamaPeruPhilippinesPolandPortugalRomaniaRussiaSaudi ArabiaScotlandSenegalSerbiaSierra LeoneSingaporeSomaliaSouth AfricaSouth AmericaSouth Central AsiaSouth Eastern AsiaSouthern EuropeSpainSri LankaSt. Vincent and the GrenadinesSudanSwedenSwitzerlandSyriaTaiwanThailandTrinidad and TobagoTurkeyUgandaUkraineUruguayUzbekistanVenezuelaVietnamWest IndiesWestern AfricaWestern AsiaWestern EuropeYemenZaireZimbabweAzores
1st Grade
Income
Poverty
Unemployment
Labor Participation
Family Structure
Vehicle Availability
Education Level
Disability

1st Grade Comparison

Spaniards

Immigrants from Zaire

Exceptional
Tragic
98.1%
1ST GRADE
91.2/ 100
METRIC RATING
131st/ 347
METRIC RANK
97.7%
1ST GRADE
4.1/ 100
METRIC RATING
223rd/ 347
METRIC RANK

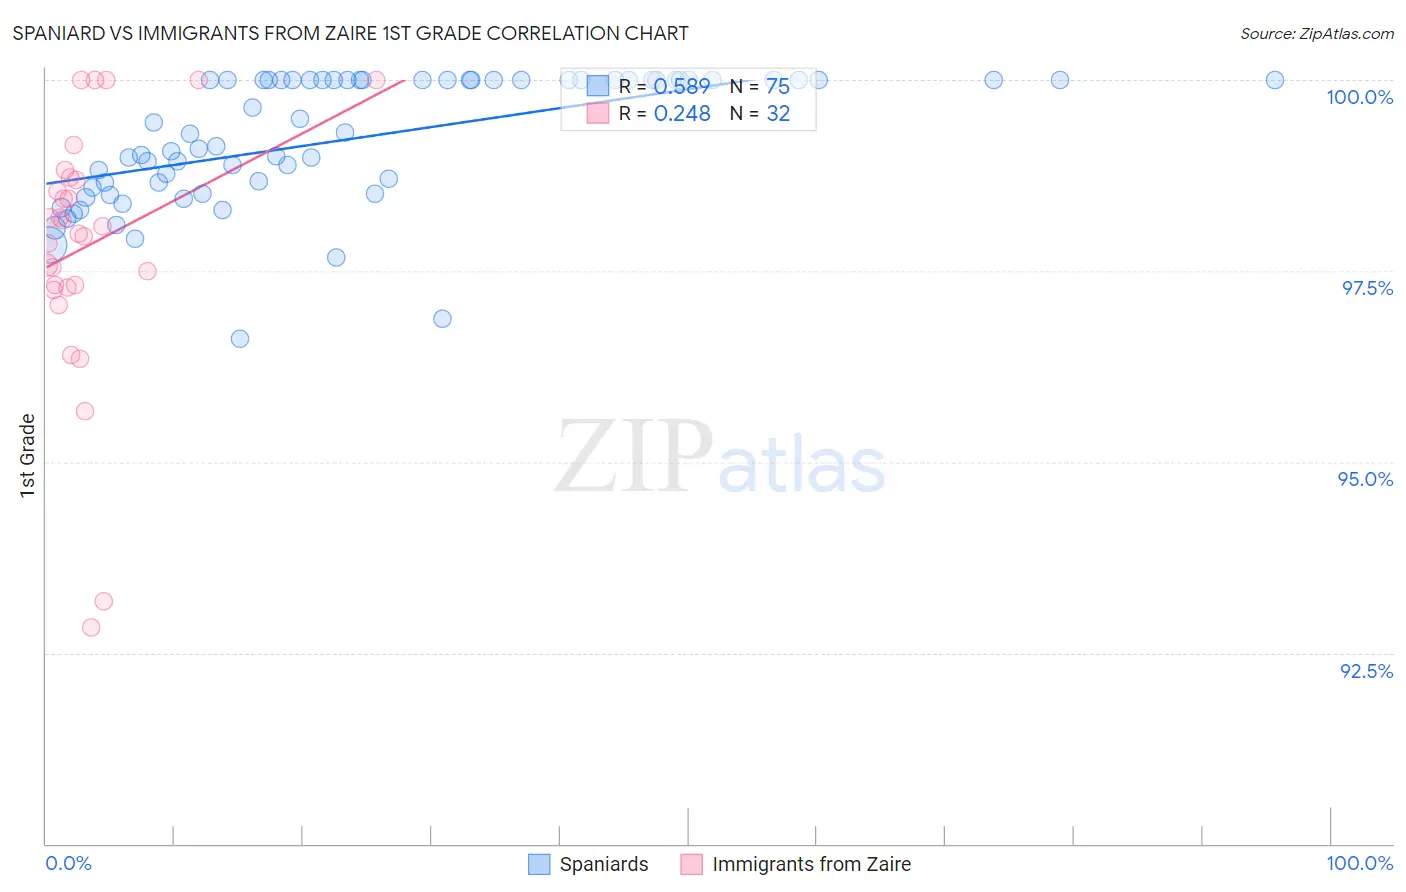
Spaniard vs Immigrants from Zaire 1st Grade Correlation Chart

The statistical analysis conducted on geographies consisting of 443,544,503 people shows a substantial positive correlation between the proportion of Spaniards and percentage of population with at least 1st grade education in the United States with a correlation coefficient (R) of 0.589 and weighted average of 98.1%. Similarly, the statistical analysis conducted on geographies consisting of 107,255,805 people shows a weak positive correlation between the proportion of Immigrants from Zaire and percentage of population with at least 1st grade education in the United States with a correlation coefficient (R) of 0.248 and weighted average of 97.7%, a difference of 0.43%.
Spaniard vs Immigrants from Zaire 1st Grade

1st Grade Correlation Summary

MeasurementSpaniardImmigrants from Zaire
Minimum96.6%92.8%
Maximum100.0%100.0%
Range3.4%7.2%
Mean99.2%97.8%
Median99.3%98.0%
Interquartile 25% (IQ1)98.6%97.3%
Interquartile 75% (IQ3)100.0%98.7%
Interquartile Range (IQR)1.4%1.4%
Standard Deviation (Sample)0.84%1.7%
Standard Deviation (Population)0.84%1.7%

Similar Demographics by 1st Grade

Demographics Similar to Spaniards by 1st Grade

In terms of 1st grade, the demographic groups most similar to Spaniards are Immigrants from Croatia (98.1%, a difference of 0.0%), Cambodian (98.1%, a difference of 0.0%), Immigrants from Serbia (98.1%, a difference of 0.010%), Seminole (98.1%, a difference of 0.010%), and Immigrants from Europe (98.1%, a difference of 0.010%).
DemographicsRating | Rank1st Grade
Syrians
93.7
/100
|
#124
Exceptional
98.1%
Immigrants | Japan
93.7
/100
|
#125
Exceptional
98.1%
Lebanese
93.5
/100
|
#126
Exceptional
98.1%
Immigrants | Saudi Arabia
93.3
/100
|
#127
Exceptional
98.1%
Immigrants | Serbia
92.2
/100
|
#128
Exceptional
98.1%
Seminole
91.9
/100
|
#129
Exceptional
98.1%
Immigrants | Croatia
91.4
/100
|
#130
Exceptional
98.1%
Spaniards
91.2
/100
|
#131
Exceptional
98.1%
Cambodians
90.9
/100
|
#132
Exceptional
98.1%
Immigrants | Europe
90.5
/100
|
#133
Exceptional
98.1%
Immigrants | Hungary
89.4
/100
|
#134
Excellent
98.1%
Immigrants | Kuwait
89.3
/100
|
#135
Excellent
98.1%
Immigrants | Bulgaria
88.8
/100
|
#136
Excellent
98.1%
Israelis
87.8
/100
|
#137
Excellent
98.1%
Immigrants | Romania
87.8
/100
|
#138
Excellent
98.1%

Demographics Similar to Immigrants from Zaire by 1st Grade

In terms of 1st grade, the demographic groups most similar to Immigrants from Zaire are Immigrants from Sudan (97.7%, a difference of 0.0%), Immigrants from Syria (97.7%, a difference of 0.0%), Iraqi (97.7%, a difference of 0.0%), Immigrants from Nepal (97.7%, a difference of 0.0%), and Tongan (97.7%, a difference of 0.010%).
DemographicsRating | Rank1st Grade
Uruguayans
7.4
/100
|
#216
Tragic
97.7%
Samoans
6.8
/100
|
#217
Tragic
97.7%
Immigrants | Morocco
5.3
/100
|
#218
Tragic
97.7%
Immigrants | Panama
5.2
/100
|
#219
Tragic
97.7%
Tongans
4.6
/100
|
#220
Tragic
97.7%
Immigrants | Sudan
4.3
/100
|
#221
Tragic
97.7%
Immigrants | Syria
4.2
/100
|
#222
Tragic
97.7%
Immigrants | Zaire
4.1
/100
|
#223
Tragic
97.7%
Iraqis
4.0
/100
|
#224
Tragic
97.7%
Immigrants | Nepal
4.0
/100
|
#225
Tragic
97.7%
Sudanese
3.7
/100
|
#226
Tragic
97.7%
Sierra Leoneans
3.6
/100
|
#227
Tragic
97.7%
Sub-Saharan Africans
3.6
/100
|
#228
Tragic
97.7%
Immigrants | Costa Rica
3.5
/100
|
#229
Tragic
97.7%
Senegalese
3.5
/100
|
#230
Tragic
97.7%