Spaniard vs Central American 1st Grade
COMPARE
Spaniard
Central American
1st Grade
1st Grade Comparison
Spaniards
Central Americans
98.1%
1ST GRADE
91.2/ 100
METRIC RATING
131st/ 347
METRIC RANK
96.5%
1ST GRADE
0.0/ 100
METRIC RATING
332nd/ 347
METRIC RANK
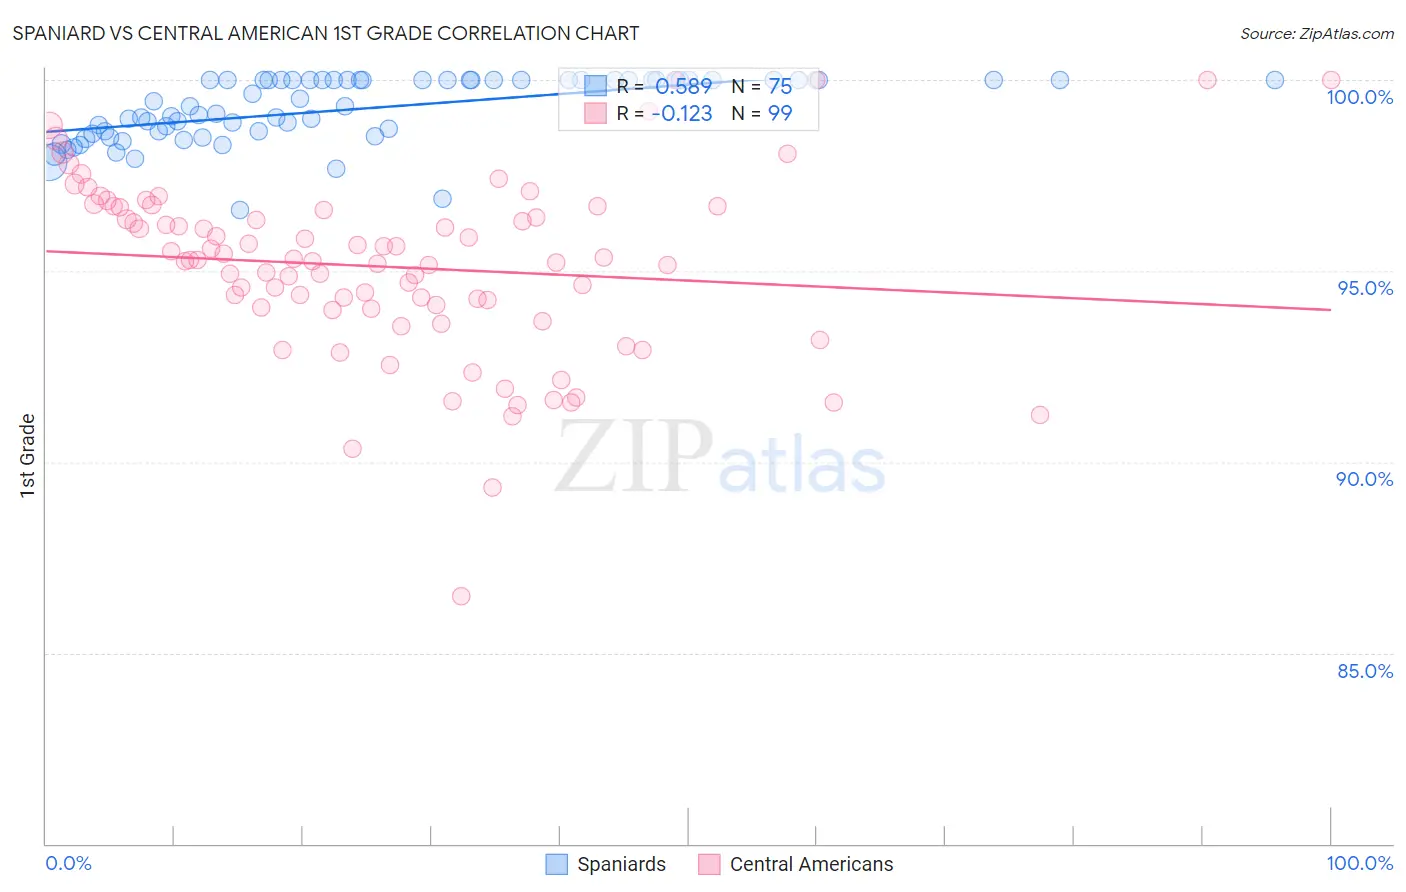
Spaniard vs Central American 1st Grade Correlation Chart
The statistical analysis conducted on geographies consisting of 443,544,503 people shows a substantial positive correlation between the proportion of Spaniards and percentage of population with at least 1st grade education in the United States with a correlation coefficient (R) of 0.589 and weighted average of 98.1%. Similarly, the statistical analysis conducted on geographies consisting of 504,619,275 people shows a poor negative correlation between the proportion of Central Americans and percentage of population with at least 1st grade education in the United States with a correlation coefficient (R) of -0.123 and weighted average of 96.5%, a difference of 1.6%.
1st Grade Correlation Summary
| Measurement | Spaniard | Central American |
| Minimum | 96.6% | 86.5% |
| Maximum | 100.0% | 100.0% |
| Range | 3.4% | 13.5% |
| Mean | 99.2% | 95.1% |
| Median | 99.3% | 95.3% |
| Interquartile 25% (IQ1) | 98.6% | 94.0% |
| Interquartile 75% (IQ3) | 100.0% | 96.7% |
| Interquartile Range (IQR) | 1.4% | 2.6% |
| Standard Deviation (Sample) | 0.84% | 2.4% |
| Standard Deviation (Population) | 0.84% | 2.3% |
Similar Demographics by 1st Grade
Demographics Similar to Spaniards by 1st Grade
In terms of 1st grade, the demographic groups most similar to Spaniards are Immigrants from Croatia (98.1%, a difference of 0.0%), Cambodian (98.1%, a difference of 0.0%), Immigrants from Serbia (98.1%, a difference of 0.010%), Seminole (98.1%, a difference of 0.010%), and Immigrants from Europe (98.1%, a difference of 0.010%).
| Demographics | Rating | Rank | 1st Grade |
| Syrians | 93.7 /100 | #124 | Exceptional 98.1% |
| Immigrants | Japan | 93.7 /100 | #125 | Exceptional 98.1% |
| Lebanese | 93.5 /100 | #126 | Exceptional 98.1% |
| Immigrants | Saudi Arabia | 93.3 /100 | #127 | Exceptional 98.1% |
| Immigrants | Serbia | 92.2 /100 | #128 | Exceptional 98.1% |
| Seminole | 91.9 /100 | #129 | Exceptional 98.1% |
| Immigrants | Croatia | 91.4 /100 | #130 | Exceptional 98.1% |
| Spaniards | 91.2 /100 | #131 | Exceptional 98.1% |
| Cambodians | 90.9 /100 | #132 | Exceptional 98.1% |
| Immigrants | Europe | 90.5 /100 | #133 | Exceptional 98.1% |
| Immigrants | Hungary | 89.4 /100 | #134 | Excellent 98.1% |
| Immigrants | Kuwait | 89.3 /100 | #135 | Excellent 98.1% |
| Immigrants | Bulgaria | 88.8 /100 | #136 | Excellent 98.1% |
| Israelis | 87.8 /100 | #137 | Excellent 98.1% |
| Immigrants | Romania | 87.8 /100 | #138 | Excellent 98.1% |
Demographics Similar to Central Americans by 1st Grade
In terms of 1st grade, the demographic groups most similar to Central Americans are Immigrants from Dominican Republic (96.5%, a difference of 0.010%), Bangladeshi (96.5%, a difference of 0.010%), Yakama (96.5%, a difference of 0.040%), Immigrants from Armenia (96.6%, a difference of 0.050%), and Guatemalan (96.5%, a difference of 0.060%).
| Demographics | Rating | Rank | 1st Grade |
| Dominicans | 0.0 /100 | #325 | Tragic 96.7% |
| Indonesians | 0.0 /100 | #326 | Tragic 96.7% |
| Mexicans | 0.0 /100 | #327 | Tragic 96.7% |
| Immigrants | Latin America | 0.0 /100 | #328 | Tragic 96.7% |
| Japanese | 0.0 /100 | #329 | Tragic 96.6% |
| Immigrants | Vietnam | 0.0 /100 | #330 | Tragic 96.6% |
| Immigrants | Armenia | 0.0 /100 | #331 | Tragic 96.6% |
| Central Americans | 0.0 /100 | #332 | Tragic 96.5% |
| Immigrants | Dominican Republic | 0.0 /100 | #333 | Tragic 96.5% |
| Bangladeshis | 0.0 /100 | #334 | Tragic 96.5% |
| Yakama | 0.0 /100 | #335 | Tragic 96.5% |
| Guatemalans | 0.0 /100 | #336 | Tragic 96.5% |
| Immigrants | Cambodia | 0.0 /100 | #337 | Tragic 96.5% |
| Immigrants | Fiji | 0.0 /100 | #338 | Tragic 96.4% |
| Immigrants | Guatemala | 0.0 /100 | #339 | Tragic 96.4% |