Somali vs Australian 12th Grade, No Diploma
COMPARE
Somali
Australian
12th Grade, No Diploma
12th Grade, No Diploma Comparison
Somalis
Australians
90.6%
12TH GRADE, NO DIPLOMA
10.2/ 100
METRIC RATING
212th/ 347
METRIC RANK
92.9%
12TH GRADE, NO DIPLOMA
99.8/ 100
METRIC RATING
48th/ 347
METRIC RANK
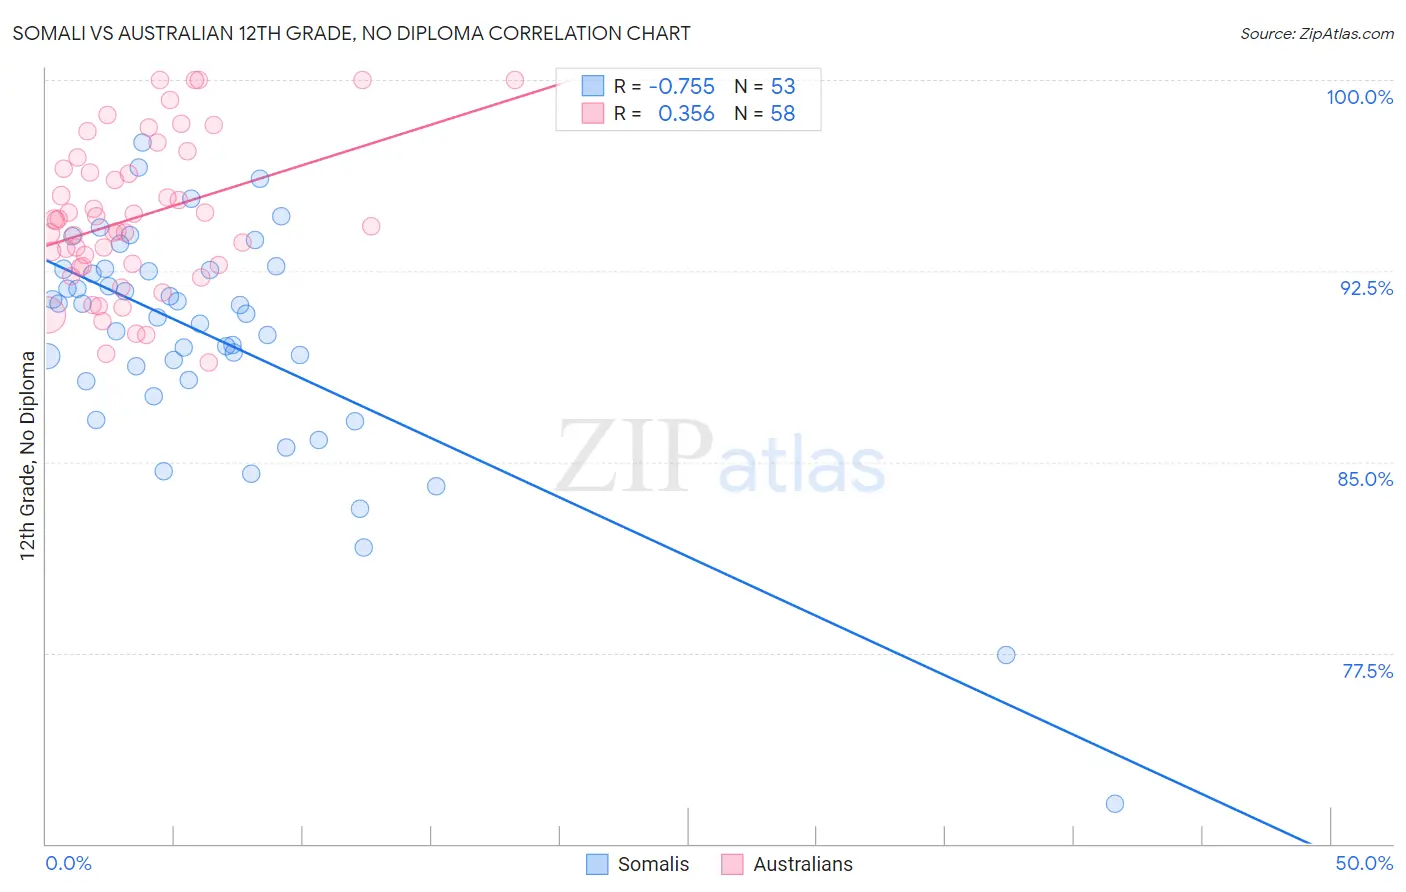
Somali vs Australian 12th Grade, No Diploma Correlation Chart
The statistical analysis conducted on geographies consisting of 99,330,527 people shows a strong negative correlation between the proportion of Somalis and percentage of population with at least 12th grade (no diploma) education in the United States with a correlation coefficient (R) of -0.755 and weighted average of 90.6%. Similarly, the statistical analysis conducted on geographies consisting of 224,152,919 people shows a mild positive correlation between the proportion of Australians and percentage of population with at least 12th grade (no diploma) education in the United States with a correlation coefficient (R) of 0.356 and weighted average of 92.9%, a difference of 2.6%.
12th Grade, No Diploma Correlation Summary
| Measurement | Somali | Australian |
| Minimum | 71.6% | 88.9% |
| Maximum | 97.6% | 100.0% |
| Range | 26.0% | 11.1% |
| Mean | 89.8% | 94.6% |
| Median | 90.8% | 94.4% |
| Interquartile 25% (IQ1) | 88.2% | 92.7% |
| Interquartile 75% (IQ3) | 92.5% | 96.5% |
| Interquartile Range (IQR) | 4.3% | 3.9% |
| Standard Deviation (Sample) | 4.6% | 2.9% |
| Standard Deviation (Population) | 4.6% | 2.9% |
Similar Demographics by 12th Grade, No Diploma
Demographics Similar to Somalis by 12th Grade, No Diploma
In terms of 12th grade, no diploma, the demographic groups most similar to Somalis are Portuguese (90.6%, a difference of 0.010%), Immigrants from Afghanistan (90.6%, a difference of 0.020%), South American Indian (90.6%, a difference of 0.020%), Immigrants from Micronesia (90.6%, a difference of 0.030%), and Costa Rican (90.5%, a difference of 0.030%).
| Demographics | Rating | Rank | 12th Grade, No Diploma |
| Immigrants | Sierra Leone | 14.9 /100 | #205 | Poor 90.7% |
| Immigrants | Bolivia | 12.3 /100 | #206 | Poor 90.6% |
| Armenians | 11.6 /100 | #207 | Poor 90.6% |
| Immigrants | Micronesia | 11.0 /100 | #208 | Poor 90.6% |
| Immigrants | Afghanistan | 11.0 /100 | #209 | Poor 90.6% |
| South American Indians | 10.9 /100 | #210 | Poor 90.6% |
| Portuguese | 10.6 /100 | #211 | Poor 90.6% |
| Somalis | 10.2 /100 | #212 | Poor 90.6% |
| Costa Ricans | 9.4 /100 | #213 | Tragic 90.5% |
| Immigrants | Africa | 8.5 /100 | #214 | Tragic 90.5% |
| Arapaho | 7.7 /100 | #215 | Tragic 90.5% |
| Shoshone | 7.5 /100 | #216 | Tragic 90.5% |
| Cherokee | 7.4 /100 | #217 | Tragic 90.5% |
| Immigrants | Cameroon | 7.4 /100 | #218 | Tragic 90.5% |
| Uruguayans | 7.0 /100 | #219 | Tragic 90.4% |
Demographics Similar to Australians by 12th Grade, No Diploma
In terms of 12th grade, no diploma, the demographic groups most similar to Australians are Belgian (92.9%, a difference of 0.010%), Macedonian (92.9%, a difference of 0.010%), British (92.9%, a difference of 0.020%), Tsimshian (92.9%, a difference of 0.020%), and Greek (92.9%, a difference of 0.030%).
| Demographics | Rating | Rank | 12th Grade, No Diploma |
| Bhutanese | 99.8 /100 | #41 | Exceptional 93.0% |
| Immigrants | Australia | 99.8 /100 | #42 | Exceptional 92.9% |
| Northern Europeans | 99.8 /100 | #43 | Exceptional 92.9% |
| Dutch | 99.8 /100 | #44 | Exceptional 92.9% |
| Greeks | 99.8 /100 | #45 | Exceptional 92.9% |
| British | 99.8 /100 | #46 | Exceptional 92.9% |
| Belgians | 99.8 /100 | #47 | Exceptional 92.9% |
| Australians | 99.8 /100 | #48 | Exceptional 92.9% |
| Macedonians | 99.8 /100 | #49 | Exceptional 92.9% |
| Tsimshian | 99.8 /100 | #50 | Exceptional 92.9% |
| Immigrants | Belgium | 99.8 /100 | #51 | Exceptional 92.9% |
| Immigrants | Sweden | 99.8 /100 | #52 | Exceptional 92.8% |
| Serbians | 99.7 /100 | #53 | Exceptional 92.8% |
| Hungarians | 99.7 /100 | #54 | Exceptional 92.8% |
| Welsh | 99.7 /100 | #55 | Exceptional 92.8% |