Serbian vs Romanian High School Diploma
COMPARE
Serbian
Romanian
High School Diploma
High School Diploma Comparison
Serbians
Romanians
91.1%
HIGH SCHOOL DIPLOMA
99.7/ 100
METRIC RATING
55th/ 347
METRIC RANK
90.7%
HIGH SCHOOL DIPLOMA
98.9/ 100
METRIC RATING
85th/ 347
METRIC RANK
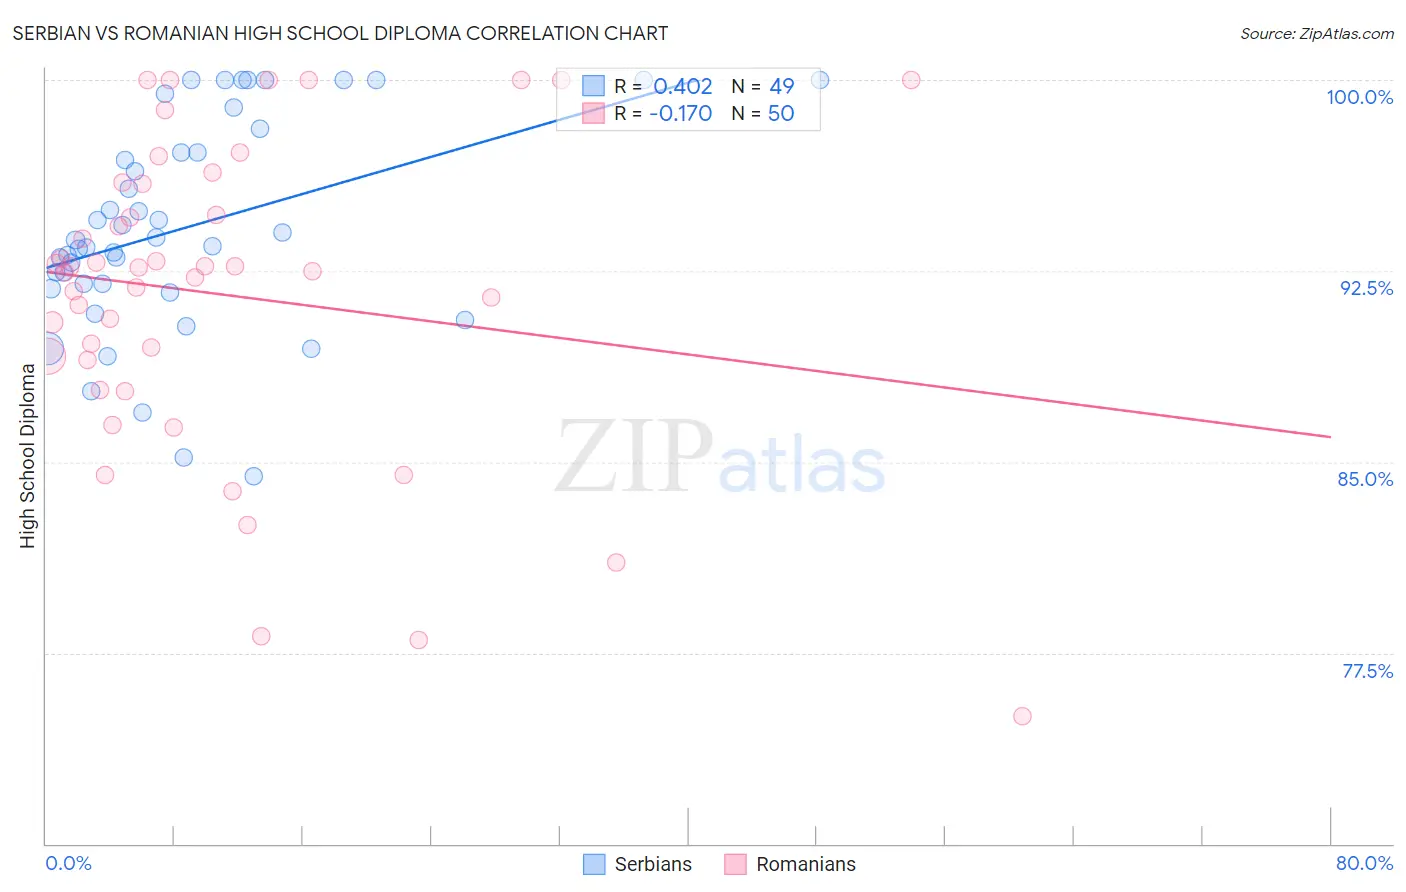
Serbian vs Romanian High School Diploma Correlation Chart
The statistical analysis conducted on geographies consisting of 267,640,774 people shows a moderate positive correlation between the proportion of Serbians and percentage of population with at least high school diploma education in the United States with a correlation coefficient (R) of 0.402 and weighted average of 91.1%. Similarly, the statistical analysis conducted on geographies consisting of 377,905,122 people shows a poor negative correlation between the proportion of Romanians and percentage of population with at least high school diploma education in the United States with a correlation coefficient (R) of -0.170 and weighted average of 90.7%, a difference of 0.50%.
High School Diploma Correlation Summary
| Measurement | Serbian | Romanian |
| Minimum | 84.5% | 75.0% |
| Maximum | 100.0% | 100.0% |
| Range | 15.5% | 25.0% |
| Mean | 94.2% | 91.6% |
| Median | 93.7% | 92.6% |
| Interquartile 25% (IQ1) | 91.9% | 89.0% |
| Interquartile 75% (IQ3) | 97.6% | 95.9% |
| Interquartile Range (IQR) | 5.7% | 7.0% |
| Standard Deviation (Sample) | 4.1% | 6.1% |
| Standard Deviation (Population) | 4.1% | 6.0% |
Similar Demographics by High School Diploma
Demographics Similar to Serbians by High School Diploma
In terms of high school diploma, the demographic groups most similar to Serbians are Macedonian (91.1%, a difference of 0.010%), Immigrants from Sweden (91.1%, a difference of 0.030%), Immigrants from Belgium (91.1%, a difference of 0.030%), Immigrants from Canada (91.1%, a difference of 0.030%), and New Zealander (91.1%, a difference of 0.040%).
| Demographics | Rating | Rank | High School Diploma |
| Belgians | 99.8 /100 | #48 | Exceptional 91.2% |
| Bhutanese | 99.8 /100 | #49 | Exceptional 91.2% |
| Welsh | 99.8 /100 | #50 | Exceptional 91.2% |
| New Zealanders | 99.7 /100 | #51 | Exceptional 91.1% |
| Immigrants | Sweden | 99.7 /100 | #52 | Exceptional 91.1% |
| Immigrants | Belgium | 99.7 /100 | #53 | Exceptional 91.1% |
| Macedonians | 99.7 /100 | #54 | Exceptional 91.1% |
| Serbians | 99.7 /100 | #55 | Exceptional 91.1% |
| Immigrants | Canada | 99.7 /100 | #56 | Exceptional 91.1% |
| Zimbabweans | 99.7 /100 | #57 | Exceptional 91.1% |
| Slavs | 99.7 /100 | #58 | Exceptional 91.0% |
| Immigrants | North America | 99.7 /100 | #59 | Exceptional 91.0% |
| Immigrants | Japan | 99.6 /100 | #60 | Exceptional 91.0% |
| Immigrants | Taiwan | 99.6 /100 | #61 | Exceptional 91.0% |
| Austrians | 99.6 /100 | #62 | Exceptional 91.0% |
Demographics Similar to Romanians by High School Diploma
In terms of high school diploma, the demographic groups most similar to Romanians are Immigrants from Bulgaria (90.6%, a difference of 0.010%), Immigrants from Turkey (90.6%, a difference of 0.010%), Immigrants from France (90.6%, a difference of 0.030%), Canadian (90.6%, a difference of 0.050%), and Celtic (90.6%, a difference of 0.060%).
| Demographics | Rating | Rank | High School Diploma |
| Burmese | 99.3 /100 | #78 | Exceptional 90.8% |
| Immigrants | Denmark | 99.3 /100 | #79 | Exceptional 90.8% |
| Immigrants | England | 99.3 /100 | #80 | Exceptional 90.8% |
| Immigrants | Switzerland | 99.3 /100 | #81 | Exceptional 90.8% |
| Scotch-Irish | 99.2 /100 | #82 | Exceptional 90.8% |
| Immigrants | Moldova | 99.2 /100 | #83 | Exceptional 90.7% |
| Immigrants | Saudi Arabia | 99.1 /100 | #84 | Exceptional 90.7% |
| Romanians | 98.9 /100 | #85 | Exceptional 90.7% |
| Immigrants | Bulgaria | 98.9 /100 | #86 | Exceptional 90.6% |
| Immigrants | Turkey | 98.9 /100 | #87 | Exceptional 90.6% |
| Immigrants | France | 98.8 /100 | #88 | Exceptional 90.6% |
| Canadians | 98.7 /100 | #89 | Exceptional 90.6% |
| Celtics | 98.7 /100 | #90 | Exceptional 90.6% |
| South Africans | 98.6 /100 | #91 | Exceptional 90.6% |
| Swiss | 98.6 /100 | #92 | Exceptional 90.6% |