Serbian vs Immigrants from Eastern Africa High School Diploma
COMPARE
Serbian
Immigrants from Eastern Africa
High School Diploma
High School Diploma Comparison
Serbians
Immigrants from Eastern Africa
91.1%
HIGH SCHOOL DIPLOMA
99.7/ 100
METRIC RATING
55th/ 347
METRIC RANK
88.9%
HIGH SCHOOL DIPLOMA
35.8/ 100
METRIC RATING
186th/ 347
METRIC RANK
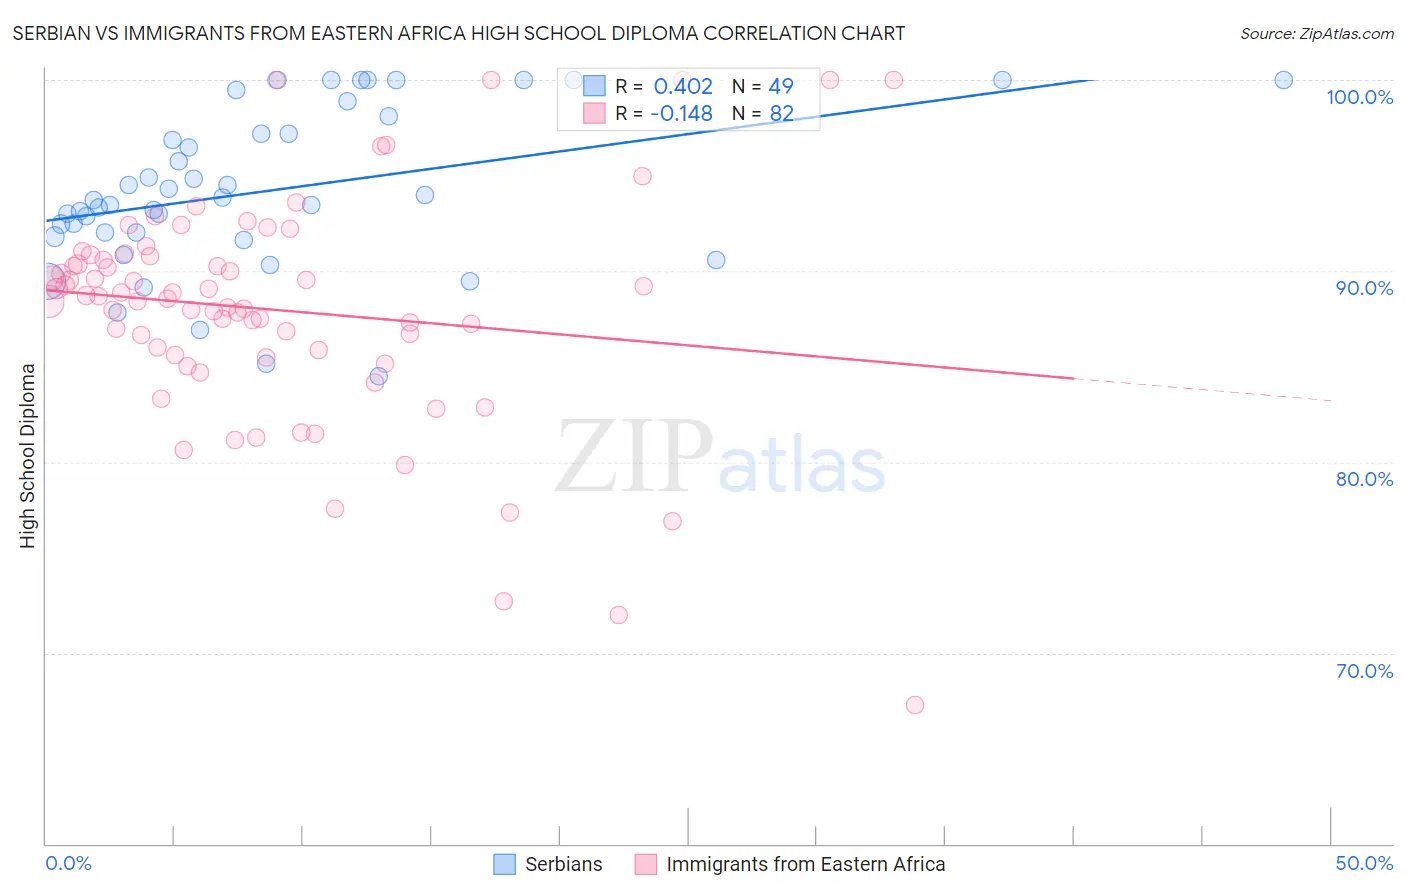
Serbian vs Immigrants from Eastern Africa High School Diploma Correlation Chart
The statistical analysis conducted on geographies consisting of 267,640,774 people shows a moderate positive correlation between the proportion of Serbians and percentage of population with at least high school diploma education in the United States with a correlation coefficient (R) of 0.402 and weighted average of 91.1%. Similarly, the statistical analysis conducted on geographies consisting of 355,153,076 people shows a poor negative correlation between the proportion of Immigrants from Eastern Africa and percentage of population with at least high school diploma education in the United States with a correlation coefficient (R) of -0.148 and weighted average of 88.9%, a difference of 2.4%.
High School Diploma Correlation Summary
| Measurement | Serbian | Immigrants from Eastern Africa |
| Minimum | 84.5% | 67.3% |
| Maximum | 100.0% | 100.0% |
| Range | 15.5% | 32.7% |
| Mean | 94.2% | 88.0% |
| Median | 93.7% | 88.6% |
| Interquartile 25% (IQ1) | 91.9% | 85.6% |
| Interquartile 75% (IQ3) | 97.6% | 90.7% |
| Interquartile Range (IQR) | 5.7% | 5.2% |
| Standard Deviation (Sample) | 4.1% | 6.0% |
| Standard Deviation (Population) | 4.1% | 6.0% |
Similar Demographics by High School Diploma
Demographics Similar to Serbians by High School Diploma
In terms of high school diploma, the demographic groups most similar to Serbians are Macedonian (91.1%, a difference of 0.010%), Immigrants from Sweden (91.1%, a difference of 0.030%), Immigrants from Belgium (91.1%, a difference of 0.030%), Immigrants from Canada (91.1%, a difference of 0.030%), and New Zealander (91.1%, a difference of 0.040%).
| Demographics | Rating | Rank | High School Diploma |
| Belgians | 99.8 /100 | #48 | Exceptional 91.2% |
| Bhutanese | 99.8 /100 | #49 | Exceptional 91.2% |
| Welsh | 99.8 /100 | #50 | Exceptional 91.2% |
| New Zealanders | 99.7 /100 | #51 | Exceptional 91.1% |
| Immigrants | Sweden | 99.7 /100 | #52 | Exceptional 91.1% |
| Immigrants | Belgium | 99.7 /100 | #53 | Exceptional 91.1% |
| Macedonians | 99.7 /100 | #54 | Exceptional 91.1% |
| Serbians | 99.7 /100 | #55 | Exceptional 91.1% |
| Immigrants | Canada | 99.7 /100 | #56 | Exceptional 91.1% |
| Zimbabweans | 99.7 /100 | #57 | Exceptional 91.1% |
| Slavs | 99.7 /100 | #58 | Exceptional 91.0% |
| Immigrants | North America | 99.7 /100 | #59 | Exceptional 91.0% |
| Immigrants | Japan | 99.6 /100 | #60 | Exceptional 91.0% |
| Immigrants | Taiwan | 99.6 /100 | #61 | Exceptional 91.0% |
| Austrians | 99.6 /100 | #62 | Exceptional 91.0% |
Demographics Similar to Immigrants from Eastern Africa by High School Diploma
In terms of high school diploma, the demographic groups most similar to Immigrants from Eastern Africa are Guamanian/Chamorro (88.9%, a difference of 0.0%), Ethiopian (89.0%, a difference of 0.020%), Immigrants from Sudan (88.9%, a difference of 0.040%), Immigrants from Uganda (88.9%, a difference of 0.050%), and Immigrants from Syria (89.0%, a difference of 0.060%).
| Demographics | Rating | Rank | High School Diploma |
| Americans | 47.2 /100 | #179 | Average 89.1% |
| Bolivians | 45.2 /100 | #180 | Average 89.1% |
| Venezuelans | 43.6 /100 | #181 | Average 89.1% |
| Spaniards | 43.4 /100 | #182 | Average 89.1% |
| Potawatomi | 42.5 /100 | #183 | Average 89.0% |
| Immigrants | Syria | 39.2 /100 | #184 | Fair 89.0% |
| Ethiopians | 37.0 /100 | #185 | Fair 89.0% |
| Immigrants | Eastern Africa | 35.8 /100 | #186 | Fair 88.9% |
| Guamanians/Chamorros | 35.5 /100 | #187 | Fair 88.9% |
| Immigrants | Sudan | 33.4 /100 | #188 | Fair 88.9% |
| Immigrants | Uganda | 32.6 /100 | #189 | Fair 88.9% |
| Immigrants | Chile | 31.9 /100 | #190 | Fair 88.9% |
| Immigrants | Ethiopia | 30.9 /100 | #191 | Fair 88.9% |
| Moroccans | 29.5 /100 | #192 | Fair 88.8% |
| Immigrants | Oceania | 26.9 /100 | #193 | Fair 88.8% |