Paraguayan vs Pima 12th Grade, No Diploma

COMPARE

Paraguayan
Race
Ancestry
AfghanAfricanAlaska NativeAlaskan AthabascanAlbanianAleutAlsatianAmericanApacheArabArapahoArgentineanArmenianAssyrian/Chaldean/SyriacAustralianAustrianBahamianBangladeshiBarbadianBasqueBelgianBelizeanBermudanBhutaneseBlackfeetBolivianBrazilianBritishBritish West IndianBulgarianBurmeseCajunCambodianCanadianCape VerdeanCarpatho RusynCelticCentral AmericanCentral American IndianCherokeeCheyenneChickasawChileanChineseChippewaChoctawColombianColvilleComancheCosta RicanCreeCreekCroatianCrowCubanCypriotCzechCzechoslovakianDanishDelawareDominicanDutchDutch West IndianEastern EuropeanEcuadorianEgyptianEnglishEstonianEthiopianEuropeanFijianFilipinoFinnishFrenchFrench American IndianFrench CanadianGermanGerman RussianGhanaianGreekGuamanian/ChamorroGuatemalanGuyaneseHaitianHmongHonduranHopiHoumaHungarianIcelanderIndian (Asian)IndonesianInupiatIranianIraqiIrishIroquoisIsraeliItalianJamaicanJapaneseJordanianKenyanKiowaKoreanLaotianLatvianLebaneseLiberianLithuanianLumbeeLuxembourgerMacedonianMalaysianMalteseMarshalleseMenomineeMexicanMexican American IndianMongolianMoroccanNative HawaiianNavajoNepaleseNew ZealanderNicaraguanNigerianNorthern EuropeanNorwegianOkinawanOsageOttawaPaiutePakistaniPalestinianPanamanianParaguayanPennsylvania GermanPeruvianPolishPortuguesePotawatomiPuebloPuerto RicanPuget Sound SalishRomanianRussianSalvadoranSamoanScandinavianScotch-IrishScottishSeminoleSenegaleseSerbianShoshoneSierra LeoneanSiouxSlavicSlovakSloveneSomaliSouth AfricanSouth AmericanSouth American IndianSoviet UnionSpaniardSpanishSpanish AmericanSpanish American IndianSri LankanSubsaharan AfricanSudaneseSwedishSwissSyrianTaiwaneseThaiTlingit-HaidaTohono O'OdhamTonganTrinidadian and TobagonianTsimshianTurkishU.S. Virgin IslanderUgandanUkrainianUruguayanUteVenezuelanVietnameseWelshWest IndianYakamaYaquiYugoslavianYumanYup'ikZimbabwean
Immigration
NonimmigrantsImmigrantsAfghanistanAfricaAlbaniaArgentinaArmeniaAsiaAustraliaAustriaBahamasBangladeshBarbadosBelarusBelgiumBelizeBoliviaBosnia and HerzegovinaBrazilBulgariaBurma/MyanmarCabo VerdeCambodiaCameroonCanadaCaribbeanCentral AmericaChileChinaColombiaCongoCosta RicaCroatiaCubaCzechoslovakiaDenmarkDominicaDominican RepublicEastern AfricaEastern AsiaEastern EuropeEcuadorEgyptEl SalvadorEnglandEritreaEthiopiaEuropeFijiFranceGermanyGhanaGreeceGrenadaGuatemalaGuyanaHaitiHondurasHong KongHungaryIndiaIndonesiaIranIraqIrelandIsraelItalyJamaicaJapanJordanKazakhstanKenyaKoreaKuwaitLaosLatin AmericaLatviaLebanonLiberiaLithuaniaMalaysiaMexicoMicronesiaMiddle AfricaMoldovaMoroccoNepalNetherlandsNicaraguaNigeriaNorth AmericaNorth MacedoniaNorthern AfricaNorthern EuropeNorwayOceaniaPakistanPanamaPeruPhilippinesPolandPortugalRomaniaRussiaSaudi ArabiaScotlandSenegalSerbiaSierra LeoneSingaporeSomaliaSouth AfricaSouth AmericaSouth Central AsiaSouth Eastern AsiaSouthern EuropeSpainSri LankaSt. Vincent and the GrenadinesSudanSwedenSwitzerlandSyriaTaiwanThailandTrinidad and TobagoTurkeyUgandaUkraineUruguayUzbekistanVenezuelaVietnamWest IndiesWestern AfricaWestern AsiaWestern EuropeYemenZaireZimbabweAzores
Pima
Race
Ancestry
AfghanAfricanAlaska NativeAlaskan AthabascanAlbanianAleutAlsatianAmericanApacheArabArapahoArgentineanArmenianAssyrian/Chaldean/SyriacAustralianAustrianBahamianBangladeshiBarbadianBasqueBelgianBelizeanBermudanBhutaneseBlackfeetBolivianBrazilianBritishBritish West IndianBulgarianBurmeseCajunCambodianCanadianCape VerdeanCarpatho RusynCelticCentral AmericanCentral American IndianCherokeeCheyenneChickasawChileanChineseChippewaChoctawColombianColvilleComancheCosta RicanCreeCreekCroatianCrowCubanCypriotCzechCzechoslovakianDanishDelawareDominicanDutchDutch West IndianEastern EuropeanEcuadorianEgyptianEnglishEstonianEthiopianEuropeanFijianFilipinoFinnishFrenchFrench American IndianFrench CanadianGermanGerman RussianGhanaianGreekGuamanian/ChamorroGuatemalanGuyaneseHaitianHmongHonduranHopiHoumaHungarianIcelanderIndian (Asian)IndonesianInupiatIranianIraqiIrishIroquoisIsraeliItalianJamaicanJapaneseJordanianKenyanKiowaKoreanLaotianLatvianLebaneseLiberianLithuanianLumbeeLuxembourgerMacedonianMalaysianMalteseMarshalleseMenomineeMexicanMexican American IndianMongolianMoroccanNative HawaiianNavajoNepaleseNew ZealanderNicaraguanNigerianNorthern EuropeanNorwegianOkinawanOsageOttawaPaiutePakistaniPalestinianPanamanianPennsylvania GermanPeruvianPimaPolishPortuguesePotawatomiPuebloPuerto RicanPuget Sound SalishRomanianRussianSalvadoranSamoanScandinavianScotch-IrishScottishSeminoleSenegaleseSerbianShoshoneSierra LeoneanSiouxSlavicSlovakSloveneSomaliSouth AfricanSouth AmericanSouth American IndianSoviet UnionSpaniardSpanishSpanish AmericanSpanish American IndianSri LankanSubsaharan AfricanSudaneseSwedishSwissSyrianTaiwaneseThaiTlingit-HaidaTohono O'OdhamTonganTrinidadian and TobagonianTsimshianTurkishU.S. Virgin IslanderUgandanUkrainianUruguayanUteVenezuelanVietnameseWelshWest IndianYakamaYaquiYugoslavianYumanYup'ikZimbabwean
Immigration
NonimmigrantsImmigrantsAfghanistanAfricaAlbaniaArgentinaArmeniaAsiaAustraliaAustriaBahamasBangladeshBarbadosBelarusBelgiumBelizeBoliviaBosnia and HerzegovinaBrazilBulgariaBurma/MyanmarCabo VerdeCambodiaCameroonCanadaCaribbeanCentral AmericaChileChinaColombiaCongoCosta RicaCroatiaCubaCzechoslovakiaDenmarkDominicaDominican RepublicEastern AfricaEastern AsiaEastern EuropeEcuadorEgyptEl SalvadorEnglandEritreaEthiopiaEuropeFijiFranceGermanyGhanaGreeceGrenadaGuatemalaGuyanaHaitiHondurasHong KongHungaryIndiaIndonesiaIranIraqIrelandIsraelItalyJamaicaJapanJordanKazakhstanKenyaKoreaKuwaitLaosLatin AmericaLatviaLebanonLiberiaLithuaniaMalaysiaMexicoMicronesiaMiddle AfricaMoldovaMoroccoNepalNetherlandsNicaraguaNigeriaNorth AmericaNorth MacedoniaNorthern AfricaNorthern EuropeNorwayOceaniaPakistanPanamaPeruPhilippinesPolandPortugalRomaniaRussiaSaudi ArabiaScotlandSenegalSerbiaSierra LeoneSingaporeSomaliaSouth AfricaSouth AmericaSouth Central AsiaSouth Eastern AsiaSouthern EuropeSpainSri LankaSt. Vincent and the GrenadinesSudanSwedenSwitzerlandSyriaTaiwanThailandTrinidad and TobagoTurkeyUgandaUkraineUruguayUzbekistanVenezuelaVietnamWest IndiesWestern AfricaWestern AsiaWestern EuropeYemenZaireZimbabweAzores
12th Grade, No Diploma
Income
Poverty
Unemployment
Labor Participation
Family Structure
Vehicle Availability
Education Level
Disability

12th Grade, No Diploma Comparison

Paraguayans

Pima

Good
Tragic
91.5%
12TH GRADE, NO DIPLOMA
78.9/ 100
METRIC RATING
150th/ 347
METRIC RANK
84.6%
12TH GRADE, NO DIPLOMA
0.0/ 100
METRIC RATING
337th/ 347
METRIC RANK

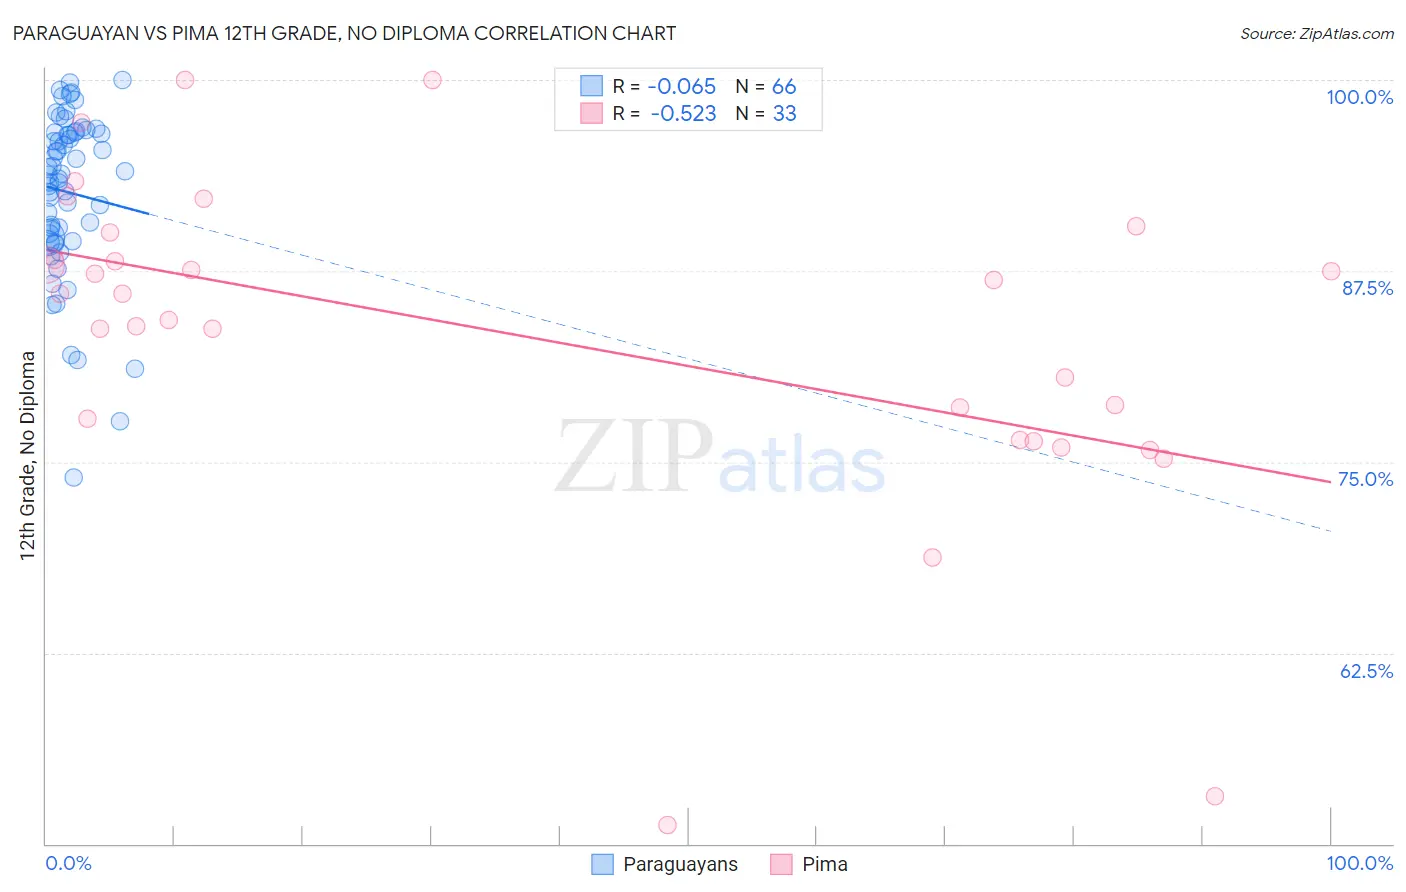
Paraguayan vs Pima 12th Grade, No Diploma Correlation Chart

The statistical analysis conducted on geographies consisting of 95,114,201 people shows a slight negative correlation between the proportion of Paraguayans and percentage of population with at least 12th grade (no diploma) education in the United States with a correlation coefficient (R) of -0.065 and weighted average of 91.5%. Similarly, the statistical analysis conducted on geographies consisting of 61,552,828 people shows a substantial negative correlation between the proportion of Pima and percentage of population with at least 12th grade (no diploma) education in the United States with a correlation coefficient (R) of -0.523 and weighted average of 84.6%, a difference of 8.2%.
Paraguayan vs Pima 12th Grade, No Diploma

12th Grade, No Diploma Correlation Summary

MeasurementParaguayanPima
Minimum73.9%51.2%
Maximum100.0%100.0%
Range26.1%48.8%
Mean92.7%83.2%
Median93.8%86.0%
Interquartile 25% (IQ1)89.7%77.1%
Interquartile 75% (IQ3)96.6%89.1%
Interquartile Range (IQR)6.9%12.0%
Standard Deviation (Sample)5.4%10.9%
Standard Deviation (Population)5.4%10.7%

Similar Demographics by 12th Grade, No Diploma

Demographics Similar to Paraguayans by 12th Grade, No Diploma

In terms of 12th grade, no diploma, the demographic groups most similar to Paraguayans are Ugandan (91.5%, a difference of 0.0%), Chippewa (91.5%, a difference of 0.0%), Pakistani (91.5%, a difference of 0.010%), Indian (Asian) (91.5%, a difference of 0.010%), and Immigrants from Spain (91.6%, a difference of 0.020%).
DemographicsRating | Rank12th Grade, No Diploma
Immigrants | Argentina
80.7
/100
|
#143
Excellent
91.6%
Immigrants | Spain
80.1
/100
|
#144
Excellent
91.6%
Immigrants | Lebanon
80.0
/100
|
#145
Excellent
91.6%
Immigrants | Brazil
79.8
/100
|
#146
Good
91.5%
Pakistanis
79.6
/100
|
#147
Good
91.5%
Indians (Asian)
79.4
/100
|
#148
Good
91.5%
Ugandans
79.0
/100
|
#149
Good
91.5%
Paraguayans
78.9
/100
|
#150
Good
91.5%
Chippewa
78.8
/100
|
#151
Good
91.5%
Kenyans
77.4
/100
|
#152
Good
91.5%
Iraqis
75.3
/100
|
#153
Good
91.5%
Immigrants | Kenya
73.9
/100
|
#154
Good
91.5%
Immigrants | Iraq
73.0
/100
|
#155
Good
91.4%
Asians
71.9
/100
|
#156
Good
91.4%
Immigrants | Pakistan
70.7
/100
|
#157
Good
91.4%

Demographics Similar to Pima by 12th Grade, No Diploma

In terms of 12th grade, no diploma, the demographic groups most similar to Pima are Guatemalan (84.6%, a difference of 0.040%), Tohono O'odham (84.7%, a difference of 0.13%), Salvadoran (84.5%, a difference of 0.14%), Immigrants from Yemen (84.8%, a difference of 0.28%), and Immigrants from Dominican Republic (84.9%, a difference of 0.32%).
DemographicsRating | Rank12th Grade, No Diploma
Immigrants | Azores
0.0
/100
|
#330
Tragic
85.3%
Central Americans
0.0
/100
|
#331
Tragic
85.2%
Immigrants | Honduras
0.0
/100
|
#332
Tragic
85.0%
Immigrants | Latin America
0.0
/100
|
#333
Tragic
85.0%
Immigrants | Dominican Republic
0.0
/100
|
#334
Tragic
84.9%
Immigrants | Yemen
0.0
/100
|
#335
Tragic
84.8%
Tohono O'odham
0.0
/100
|
#336
Tragic
84.7%
Pima
0.0
/100
|
#337
Tragic
84.6%
Guatemalans
0.0
/100
|
#338
Tragic
84.6%
Salvadorans
0.0
/100
|
#339
Tragic
84.5%
Mexicans
0.0
/100
|
#340
Tragic
84.1%
Immigrants | Guatemala
0.0
/100
|
#341
Tragic
84.0%
Houma
0.0
/100
|
#342
Tragic
83.7%
Immigrants | El Salvador
0.0
/100
|
#343
Tragic
83.6%
Immigrants | Central America
0.0
/100
|
#344
Tragic
83.0%