Osage vs Paraguayan 7th Grade

COMPARE

Osage
Race
Ancestry
AfghanAfricanAlaska NativeAlaskan AthabascanAlbanianAleutAlsatianAmericanApacheArabArapahoArgentineanArmenianAssyrian/Chaldean/SyriacAustralianAustrianBahamianBangladeshiBarbadianBasqueBelgianBelizeanBermudanBhutaneseBlackfeetBolivianBrazilianBritishBritish West IndianBulgarianBurmeseCajunCambodianCanadianCape VerdeanCarpatho RusynCelticCentral AmericanCentral American IndianCherokeeCheyenneChickasawChileanChineseChippewaChoctawColombianColvilleComancheCosta RicanCreeCreekCroatianCrowCubanCypriotCzechCzechoslovakianDanishDelawareDominicanDutchDutch West IndianEastern EuropeanEcuadorianEgyptianEnglishEstonianEthiopianEuropeanFijianFilipinoFinnishFrenchFrench American IndianFrench CanadianGermanGerman RussianGhanaianGreekGuamanian/ChamorroGuatemalanGuyaneseHaitianHmongHonduranHopiHoumaHungarianIcelanderIndian (Asian)IndonesianInupiatIranianIraqiIrishIroquoisIsraeliItalianJamaicanJapaneseJordanianKenyanKiowaKoreanLaotianLatvianLebaneseLiberianLithuanianLumbeeLuxembourgerMacedonianMalaysianMalteseMarshalleseMenomineeMexicanMexican American IndianMongolianMoroccanNative HawaiianNavajoNepaleseNew ZealanderNicaraguanNigerianNorthern EuropeanNorwegianOkinawanOsageOttawaPaiutePakistaniPalestinianPanamanianPennsylvania GermanPeruvianPimaPolishPortuguesePotawatomiPuebloPuerto RicanPuget Sound SalishRomanianRussianSalvadoranSamoanScandinavianScotch-IrishScottishSeminoleSenegaleseSerbianShoshoneSierra LeoneanSiouxSlavicSlovakSloveneSomaliSouth AfricanSouth AmericanSouth American IndianSoviet UnionSpaniardSpanishSpanish AmericanSpanish American IndianSri LankanSubsaharan AfricanSudaneseSwedishSwissSyrianTaiwaneseThaiTlingit-HaidaTohono O'OdhamTonganTrinidadian and TobagonianTsimshianTurkishU.S. Virgin IslanderUgandanUkrainianUruguayanUteVenezuelanVietnameseWelshWest IndianYakamaYaquiYugoslavianYumanYup'ikZimbabwean
Immigration
NonimmigrantsImmigrantsAfghanistanAfricaAlbaniaArgentinaArmeniaAsiaAustraliaAustriaBahamasBangladeshBarbadosBelarusBelgiumBelizeBoliviaBosnia and HerzegovinaBrazilBulgariaBurma/MyanmarCabo VerdeCambodiaCameroonCanadaCaribbeanCentral AmericaChileChinaColombiaCongoCosta RicaCroatiaCubaCzechoslovakiaDenmarkDominicaDominican RepublicEastern AfricaEastern AsiaEastern EuropeEcuadorEgyptEl SalvadorEnglandEritreaEthiopiaEuropeFijiFranceGermanyGhanaGreeceGrenadaGuatemalaGuyanaHaitiHondurasHong KongHungaryIndiaIndonesiaIranIraqIrelandIsraelItalyJamaicaJapanJordanKazakhstanKenyaKoreaKuwaitLaosLatin AmericaLatviaLebanonLiberiaLithuaniaMalaysiaMexicoMicronesiaMiddle AfricaMoldovaMoroccoNepalNetherlandsNicaraguaNigeriaNorth AmericaNorth MacedoniaNorthern AfricaNorthern EuropeNorwayOceaniaPakistanPanamaPeruPhilippinesPolandPortugalRomaniaRussiaSaudi ArabiaScotlandSenegalSerbiaSierra LeoneSingaporeSomaliaSouth AfricaSouth AmericaSouth Central AsiaSouth Eastern AsiaSouthern EuropeSpainSri LankaSt. Vincent and the GrenadinesSudanSwedenSwitzerlandSyriaTaiwanThailandTrinidad and TobagoTurkeyUgandaUkraineUruguayUzbekistanVenezuelaVietnamWest IndiesWestern AfricaWestern AsiaWestern EuropeYemenZaireZimbabweAzores
Paraguayan
Race
Ancestry
AfghanAfricanAlaska NativeAlaskan AthabascanAlbanianAleutAlsatianAmericanApacheArabArapahoArgentineanArmenianAssyrian/Chaldean/SyriacAustralianAustrianBahamianBangladeshiBarbadianBasqueBelgianBelizeanBermudanBhutaneseBlackfeetBolivianBrazilianBritishBritish West IndianBulgarianBurmeseCajunCambodianCanadianCape VerdeanCarpatho RusynCelticCentral AmericanCentral American IndianCherokeeCheyenneChickasawChileanChineseChippewaChoctawColombianColvilleComancheCosta RicanCreeCreekCroatianCrowCubanCypriotCzechCzechoslovakianDanishDelawareDominicanDutchDutch West IndianEastern EuropeanEcuadorianEgyptianEnglishEstonianEthiopianEuropeanFijianFilipinoFinnishFrenchFrench American IndianFrench CanadianGermanGerman RussianGhanaianGreekGuamanian/ChamorroGuatemalanGuyaneseHaitianHmongHonduranHopiHoumaHungarianIcelanderIndian (Asian)IndonesianInupiatIranianIraqiIrishIroquoisIsraeliItalianJamaicanJapaneseJordanianKenyanKiowaKoreanLaotianLatvianLebaneseLiberianLithuanianLumbeeLuxembourgerMacedonianMalaysianMalteseMarshalleseMenomineeMexicanMexican American IndianMongolianMoroccanNative HawaiianNavajoNepaleseNew ZealanderNicaraguanNigerianNorthern EuropeanNorwegianOkinawanOttawaPaiutePakistaniPalestinianPanamanianParaguayanPennsylvania GermanPeruvianPimaPolishPortuguesePotawatomiPuebloPuerto RicanPuget Sound SalishRomanianRussianSalvadoranSamoanScandinavianScotch-IrishScottishSeminoleSenegaleseSerbianShoshoneSierra LeoneanSiouxSlavicSlovakSloveneSomaliSouth AfricanSouth AmericanSouth American IndianSoviet UnionSpaniardSpanishSpanish AmericanSpanish American IndianSri LankanSubsaharan AfricanSudaneseSwedishSwissSyrianTaiwaneseThaiTlingit-HaidaTohono O'OdhamTonganTrinidadian and TobagonianTsimshianTurkishU.S. Virgin IslanderUgandanUkrainianUruguayanUteVenezuelanVietnameseWelshWest IndianYakamaYaquiYugoslavianYumanYup'ikZimbabwean
Immigration
NonimmigrantsImmigrantsAfghanistanAfricaAlbaniaArgentinaArmeniaAsiaAustraliaAustriaBahamasBangladeshBarbadosBelarusBelgiumBelizeBoliviaBosnia and HerzegovinaBrazilBulgariaBurma/MyanmarCabo VerdeCambodiaCameroonCanadaCaribbeanCentral AmericaChileChinaColombiaCongoCosta RicaCroatiaCubaCzechoslovakiaDenmarkDominicaDominican RepublicEastern AfricaEastern AsiaEastern EuropeEcuadorEgyptEl SalvadorEnglandEritreaEthiopiaEuropeFijiFranceGermanyGhanaGreeceGrenadaGuatemalaGuyanaHaitiHondurasHong KongHungaryIndiaIndonesiaIranIraqIrelandIsraelItalyJamaicaJapanJordanKazakhstanKenyaKoreaKuwaitLaosLatin AmericaLatviaLebanonLiberiaLithuaniaMalaysiaMexicoMicronesiaMiddle AfricaMoldovaMoroccoNepalNetherlandsNicaraguaNigeriaNorth AmericaNorth MacedoniaNorthern AfricaNorthern EuropeNorwayOceaniaPakistanPanamaPeruPhilippinesPolandPortugalRomaniaRussiaSaudi ArabiaScotlandSenegalSerbiaSierra LeoneSingaporeSomaliaSouth AfricaSouth AmericaSouth Central AsiaSouth Eastern AsiaSouthern EuropeSpainSri LankaSt. Vincent and the GrenadinesSudanSwedenSwitzerlandSyriaTaiwanThailandTrinidad and TobagoTurkeyUgandaUkraineUruguayUzbekistanVenezuelaVietnamWest IndiesWestern AfricaWestern AsiaWestern EuropeYemenZaireZimbabweAzores
7th Grade
Income
Poverty
Unemployment
Labor Participation
Family Structure
Vehicle Availability
Education Level
Disability

7th Grade Comparison

Osage

Paraguayans

Exceptional
Fair
96.7%
7TH GRADE
98.9/ 100
METRIC RATING
91st/ 347
METRIC RANK
95.9%
7TH GRADE
24.8/ 100
METRIC RATING
198th/ 347
METRIC RANK

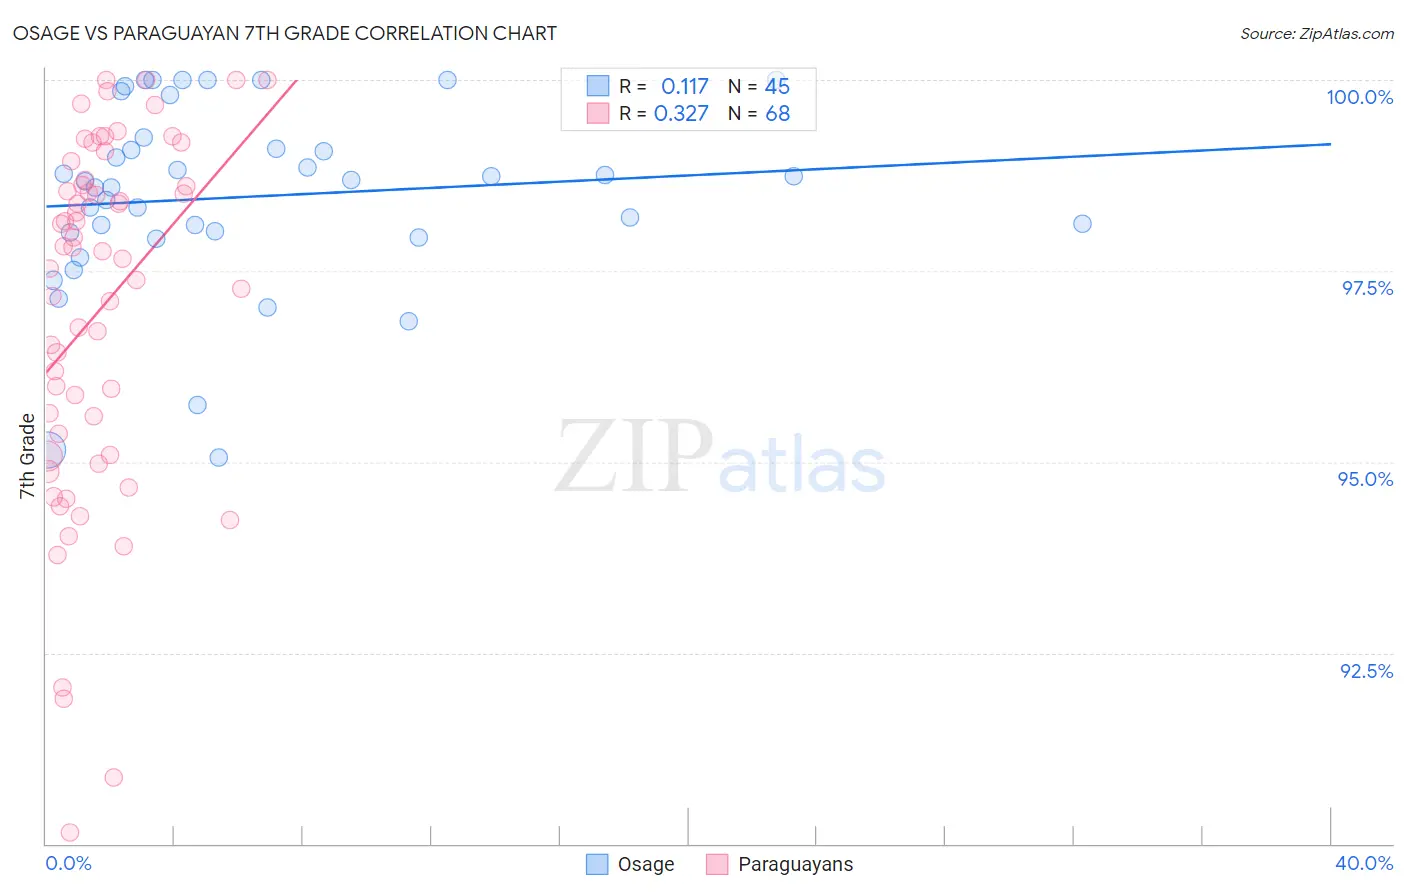
Osage vs Paraguayan 7th Grade Correlation Chart

The statistical analysis conducted on geographies consisting of 91,808,929 people shows a poor positive correlation between the proportion of Osage and percentage of population with at least 7th grade education in the United States with a correlation coefficient (R) of 0.117 and weighted average of 96.7%. Similarly, the statistical analysis conducted on geographies consisting of 95,115,093 people shows a mild positive correlation between the proportion of Paraguayans and percentage of population with at least 7th grade education in the United States with a correlation coefficient (R) of 0.327 and weighted average of 95.9%, a difference of 0.87%.
Osage vs Paraguayan 7th Grade

7th Grade Correlation Summary

MeasurementOsageParaguayan
Minimum95.1%90.2%
Maximum100.0%100.0%
Range4.9%9.8%
Mean98.5%97.0%
Median98.7%97.7%
Interquartile 25% (IQ1)98.0%95.2%
Interquartile 75% (IQ3)99.2%98.7%
Interquartile Range (IQR)1.2%3.4%
Standard Deviation (Sample)1.2%2.3%
Standard Deviation (Population)1.2%2.3%

Similar Demographics by 7th Grade

Demographics Similar to Osage by 7th Grade

In terms of 7th grade, the demographic groups most similar to Osage are Immigrants from South Africa (96.7%, a difference of 0.0%), Immigrants from Western Europe (96.7%, a difference of 0.0%), Potawatomi (96.7%, a difference of 0.0%), Immigrants from Belgium (96.7%, a difference of 0.010%), and Puget Sound Salish (96.7%, a difference of 0.010%).
DemographicsRating | Rank7th Grade
Romanians
99.1
/100
|
#84
Exceptional
96.7%
Kiowa
99.1
/100
|
#85
Exceptional
96.7%
Turks
99.1
/100
|
#86
Exceptional
96.7%
Immigrants | Belgium
99.0
/100
|
#87
Exceptional
96.7%
Puget Sound Salish
99.0
/100
|
#88
Exceptional
96.7%
Cree
99.0
/100
|
#89
Exceptional
96.7%
Immigrants | South Africa
98.9
/100
|
#90
Exceptional
96.7%
Osage
98.9
/100
|
#91
Exceptional
96.7%
Immigrants | Western Europe
98.9
/100
|
#92
Exceptional
96.7%
Potawatomi
98.9
/100
|
#93
Exceptional
96.7%
Lebanese
98.8
/100
|
#94
Exceptional
96.7%
Immigrants | Australia
98.8
/100
|
#95
Exceptional
96.7%
Immigrants | Denmark
98.7
/100
|
#96
Exceptional
96.7%
Immigrants | Germany
98.7
/100
|
#97
Exceptional
96.7%
Immigrants | Sweden
98.7
/100
|
#98
Exceptional
96.7%

Demographics Similar to Paraguayans by 7th Grade

In terms of 7th grade, the demographic groups most similar to Paraguayans are Guamanian/Chamorro (95.9%, a difference of 0.010%), Argentinean (95.9%, a difference of 0.010%), Apache (95.9%, a difference of 0.020%), Immigrants from Zaire (95.9%, a difference of 0.020%), and Immigrants from Argentina (95.9%, a difference of 0.020%).
DemographicsRating | Rank7th Grade
Liberians
32.5
/100
|
#191
Fair
95.9%
Panamanians
32.3
/100
|
#192
Fair
95.9%
Immigrants | Bahamas
30.8
/100
|
#193
Fair
95.9%
Immigrants | Nepal
30.0
/100
|
#194
Fair
95.9%
Sudanese
28.1
/100
|
#195
Fair
95.9%
Apache
27.6
/100
|
#196
Fair
95.9%
Immigrants | Zaire
26.7
/100
|
#197
Fair
95.9%
Paraguayans
24.8
/100
|
#198
Fair
95.9%
Guamanians/Chamorros
23.5
/100
|
#199
Fair
95.9%
Argentineans
23.2
/100
|
#200
Fair
95.9%
Immigrants | Argentina
21.9
/100
|
#201
Fair
95.9%
Immigrants | Northern Africa
21.4
/100
|
#202
Fair
95.8%
Comanche
21.1
/100
|
#203
Fair
95.8%
Assyrians/Chaldeans/Syriacs
20.5
/100
|
#204
Fair
95.8%
Moroccans
18.9
/100
|
#205
Poor
95.8%