Immigrants from Malaysia vs Paraguayan 7th Grade

COMPARE

Immigrants from Malaysia
Race
Ancestry
AfghanAfricanAlaska NativeAlaskan AthabascanAlbanianAleutAlsatianAmericanApacheArabArapahoArgentineanArmenianAssyrian/Chaldean/SyriacAustralianAustrianBahamianBangladeshiBarbadianBasqueBelgianBelizeanBermudanBhutaneseBlackfeetBolivianBrazilianBritishBritish West IndianBulgarianBurmeseCajunCambodianCanadianCape VerdeanCarpatho RusynCelticCentral AmericanCentral American IndianCherokeeCheyenneChickasawChileanChineseChippewaChoctawColombianColvilleComancheCosta RicanCreeCreekCroatianCrowCubanCypriotCzechCzechoslovakianDanishDelawareDominicanDutchDutch West IndianEastern EuropeanEcuadorianEgyptianEnglishEstonianEthiopianEuropeanFijianFilipinoFinnishFrenchFrench American IndianFrench CanadianGermanGerman RussianGhanaianGreekGuamanian/ChamorroGuatemalanGuyaneseHaitianHmongHonduranHopiHoumaHungarianIcelanderIndian (Asian)IndonesianInupiatIranianIraqiIrishIroquoisIsraeliItalianJamaicanJapaneseJordanianKenyanKiowaKoreanLaotianLatvianLebaneseLiberianLithuanianLumbeeLuxembourgerMacedonianMalaysianMalteseMarshalleseMenomineeMexicanMexican American IndianMongolianMoroccanNative HawaiianNavajoNepaleseNew ZealanderNicaraguanNigerianNorthern EuropeanNorwegianOkinawanOsageOttawaPaiutePakistaniPalestinianPanamanianPennsylvania GermanPeruvianPimaPolishPortuguesePotawatomiPuebloPuerto RicanPuget Sound SalishRomanianRussianSalvadoranSamoanScandinavianScotch-IrishScottishSeminoleSenegaleseSerbianShoshoneSierra LeoneanSiouxSlavicSlovakSloveneSomaliSouth AfricanSouth AmericanSouth American IndianSoviet UnionSpaniardSpanishSpanish AmericanSpanish American IndianSri LankanSubsaharan AfricanSudaneseSwedishSwissSyrianTaiwaneseThaiTlingit-HaidaTohono O'OdhamTonganTrinidadian and TobagonianTsimshianTurkishU.S. Virgin IslanderUgandanUkrainianUruguayanUteVenezuelanVietnameseWelshWest IndianYakamaYaquiYugoslavianYumanYup'ikZimbabwean
Immigration
NonimmigrantsImmigrantsAfghanistanAfricaAlbaniaArgentinaArmeniaAsiaAustraliaAustriaBahamasBangladeshBarbadosBelarusBelgiumBelizeBoliviaBosnia and HerzegovinaBrazilBulgariaBurma/MyanmarCabo VerdeCambodiaCameroonCanadaCaribbeanCentral AmericaChileChinaColombiaCongoCosta RicaCroatiaCubaCzechoslovakiaDenmarkDominicaDominican RepublicEastern AfricaEastern AsiaEastern EuropeEcuadorEgyptEl SalvadorEnglandEritreaEthiopiaEuropeFijiFranceGermanyGhanaGreeceGrenadaGuatemalaGuyanaHaitiHondurasHong KongHungaryIndiaIndonesiaIranIraqIrelandIsraelItalyJamaicaJapanJordanKazakhstanKenyaKoreaKuwaitLaosLatin AmericaLatviaLebanonLiberiaLithuaniaMalaysiaMexicoMicronesiaMiddle AfricaMoldovaMoroccoNepalNetherlandsNicaraguaNigeriaNorth AmericaNorth MacedoniaNorthern AfricaNorthern EuropeNorwayOceaniaPakistanPanamaPeruPhilippinesPolandPortugalRomaniaRussiaSaudi ArabiaScotlandSenegalSerbiaSierra LeoneSingaporeSomaliaSouth AfricaSouth AmericaSouth Central AsiaSouth Eastern AsiaSouthern EuropeSpainSri LankaSt. Vincent and the GrenadinesSudanSwedenSwitzerlandSyriaTaiwanThailandTrinidad and TobagoTurkeyUgandaUkraineUruguayUzbekistanVenezuelaVietnamWest IndiesWestern AfricaWestern AsiaWestern EuropeYemenZaireZimbabweAzores
Paraguayan
Race
Ancestry
AfghanAfricanAlaska NativeAlaskan AthabascanAlbanianAleutAlsatianAmericanApacheArabArapahoArgentineanArmenianAssyrian/Chaldean/SyriacAustralianAustrianBahamianBangladeshiBarbadianBasqueBelgianBelizeanBermudanBhutaneseBlackfeetBolivianBrazilianBritishBritish West IndianBulgarianBurmeseCajunCambodianCanadianCape VerdeanCarpatho RusynCelticCentral AmericanCentral American IndianCherokeeCheyenneChickasawChileanChineseChippewaChoctawColombianColvilleComancheCosta RicanCreeCreekCroatianCrowCubanCypriotCzechCzechoslovakianDanishDelawareDominicanDutchDutch West IndianEastern EuropeanEcuadorianEgyptianEnglishEstonianEthiopianEuropeanFijianFilipinoFinnishFrenchFrench American IndianFrench CanadianGermanGerman RussianGhanaianGreekGuamanian/ChamorroGuatemalanGuyaneseHaitianHmongHonduranHopiHoumaHungarianIcelanderIndian (Asian)IndonesianInupiatIranianIraqiIrishIroquoisIsraeliItalianJamaicanJapaneseJordanianKenyanKiowaKoreanLaotianLatvianLebaneseLiberianLithuanianLumbeeLuxembourgerMacedonianMalaysianMalteseMarshalleseMenomineeMexicanMexican American IndianMongolianMoroccanNative HawaiianNavajoNepaleseNew ZealanderNicaraguanNigerianNorthern EuropeanNorwegianOkinawanOsageOttawaPaiutePakistaniPalestinianPanamanianParaguayanPennsylvania GermanPeruvianPimaPolishPortuguesePotawatomiPuebloPuerto RicanPuget Sound SalishRomanianRussianSalvadoranSamoanScandinavianScotch-IrishScottishSeminoleSenegaleseSerbianShoshoneSierra LeoneanSiouxSlavicSlovakSloveneSomaliSouth AfricanSouth AmericanSouth American IndianSoviet UnionSpaniardSpanishSpanish AmericanSpanish American IndianSri LankanSubsaharan AfricanSudaneseSwedishSwissSyrianTaiwaneseThaiTlingit-HaidaTohono O'OdhamTonganTrinidadian and TobagonianTsimshianTurkishU.S. Virgin IslanderUgandanUkrainianUruguayanUteVenezuelanVietnameseWelshWest IndianYakamaYaquiYugoslavianYumanYup'ikZimbabwean
Immigration
NonimmigrantsImmigrantsAfghanistanAfricaAlbaniaArgentinaArmeniaAsiaAustraliaAustriaBahamasBangladeshBarbadosBelarusBelgiumBelizeBoliviaBosnia and HerzegovinaBrazilBulgariaBurma/MyanmarCabo VerdeCambodiaCameroonCanadaCaribbeanCentral AmericaChileChinaColombiaCongoCosta RicaCroatiaCubaCzechoslovakiaDenmarkDominicaDominican RepublicEastern AfricaEastern AsiaEastern EuropeEcuadorEgyptEl SalvadorEnglandEritreaEthiopiaEuropeFijiFranceGermanyGhanaGreeceGrenadaGuatemalaGuyanaHaitiHondurasHong KongHungaryIndiaIndonesiaIranIraqIrelandIsraelItalyJamaicaJapanJordanKazakhstanKenyaKoreaKuwaitLaosLatin AmericaLatviaLebanonLiberiaLithuaniaMexicoMicronesiaMiddle AfricaMoldovaMoroccoNepalNetherlandsNicaraguaNigeriaNorth AmericaNorth MacedoniaNorthern AfricaNorthern EuropeNorwayOceaniaPakistanPanamaPeruPhilippinesPolandPortugalRomaniaRussiaSaudi ArabiaScotlandSenegalSerbiaSierra LeoneSingaporeSomaliaSouth AfricaSouth AmericaSouth Central AsiaSouth Eastern AsiaSouthern EuropeSpainSri LankaSt. Vincent and the GrenadinesSudanSwedenSwitzerlandSyriaTaiwanThailandTrinidad and TobagoTurkeyUgandaUkraineUruguayUzbekistanVenezuelaVietnamWest IndiesWestern AfricaWestern AsiaWestern EuropeYemenZaireZimbabweAzores
7th Grade
Income
Poverty
Unemployment
Labor Participation
Family Structure
Vehicle Availability
Education Level
Disability

7th Grade Comparison

Immigrants from Malaysia

Paraguayans

Tragic
Fair
95.6%
7TH GRADE
6.2/ 100
METRIC RATING
225th/ 347
METRIC RANK
95.9%
7TH GRADE
24.8/ 100
METRIC RATING
198th/ 347
METRIC RANK

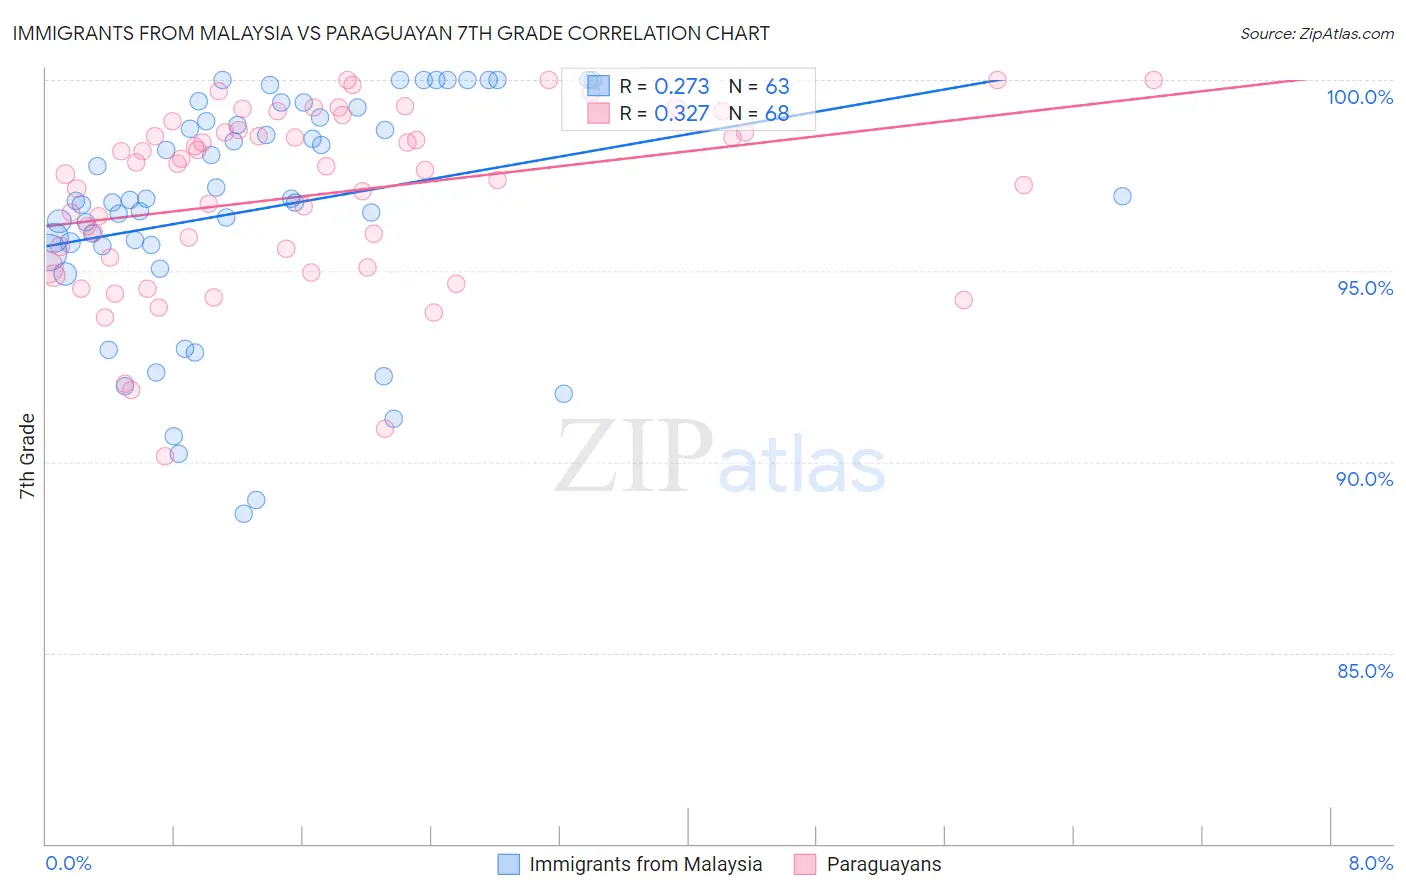
Immigrants from Malaysia vs Paraguayan 7th Grade Correlation Chart

The statistical analysis conducted on geographies consisting of 197,973,709 people shows a weak positive correlation between the proportion of Immigrants from Malaysia and percentage of population with at least 7th grade education in the United States with a correlation coefficient (R) of 0.273 and weighted average of 95.6%. Similarly, the statistical analysis conducted on geographies consisting of 95,115,093 people shows a mild positive correlation between the proportion of Paraguayans and percentage of population with at least 7th grade education in the United States with a correlation coefficient (R) of 0.327 and weighted average of 95.9%, a difference of 0.25%.
Immigrants from Malaysia vs Paraguayan 7th Grade

7th Grade Correlation Summary

MeasurementImmigrants from MalaysiaParaguayan
Minimum88.6%90.2%
Maximum100.0%100.0%
Range11.4%9.8%
Mean96.6%97.0%
Median96.8%97.7%
Interquartile 25% (IQ1)95.6%95.2%
Interquartile 75% (IQ3)99.0%98.7%
Interquartile Range (IQR)3.4%3.4%
Standard Deviation (Sample)3.0%2.3%
Standard Deviation (Population)3.0%2.3%

Similar Demographics by 7th Grade

Demographics Similar to Immigrants from Malaysia by 7th Grade

In terms of 7th grade, the demographic groups most similar to Immigrants from Malaysia are Immigrants from Syria (95.7%, a difference of 0.010%), Immigrants from Oceania (95.7%, a difference of 0.010%), Immigrants from Eastern Asia (95.6%, a difference of 0.010%), Subsaharan African (95.7%, a difference of 0.020%), and Samoan (95.7%, a difference of 0.020%).
DemographicsRating | Rank7th Grade
Immigrants | Liberia
8.1
/100
|
#218
Tragic
95.7%
Immigrants | Southern Europe
7.9
/100
|
#219
Tragic
95.7%
Sub-Saharan Africans
7.2
/100
|
#220
Tragic
95.7%
Samoans
7.0
/100
|
#221
Tragic
95.7%
Laotians
6.8
/100
|
#222
Tragic
95.7%
Immigrants | Syria
6.7
/100
|
#223
Tragic
95.7%
Immigrants | Oceania
6.7
/100
|
#224
Tragic
95.7%
Immigrants | Malaysia
6.2
/100
|
#225
Tragic
95.6%
Immigrants | Eastern Asia
5.8
/100
|
#226
Tragic
95.6%
Immigrants | Western Asia
5.4
/100
|
#227
Tragic
95.6%
Immigrants | Eastern Africa
5.1
/100
|
#228
Tragic
95.6%
Immigrants | Panama
4.9
/100
|
#229
Tragic
95.6%
Natives/Alaskans
4.2
/100
|
#230
Tragic
95.6%
Senegalese
4.0
/100
|
#231
Tragic
95.6%
Costa Ricans
3.3
/100
|
#232
Tragic
95.5%

Demographics Similar to Paraguayans by 7th Grade

In terms of 7th grade, the demographic groups most similar to Paraguayans are Guamanian/Chamorro (95.9%, a difference of 0.010%), Argentinean (95.9%, a difference of 0.010%), Apache (95.9%, a difference of 0.020%), Immigrants from Zaire (95.9%, a difference of 0.020%), and Immigrants from Argentina (95.9%, a difference of 0.020%).
DemographicsRating | Rank7th Grade
Liberians
32.5
/100
|
#191
Fair
95.9%
Panamanians
32.3
/100
|
#192
Fair
95.9%
Immigrants | Bahamas
30.8
/100
|
#193
Fair
95.9%
Immigrants | Nepal
30.0
/100
|
#194
Fair
95.9%
Sudanese
28.1
/100
|
#195
Fair
95.9%
Apache
27.6
/100
|
#196
Fair
95.9%
Immigrants | Zaire
26.7
/100
|
#197
Fair
95.9%
Paraguayans
24.8
/100
|
#198
Fair
95.9%
Guamanians/Chamorros
23.5
/100
|
#199
Fair
95.9%
Argentineans
23.2
/100
|
#200
Fair
95.9%
Immigrants | Argentina
21.9
/100
|
#201
Fair
95.9%
Immigrants | Northern Africa
21.4
/100
|
#202
Fair
95.8%
Comanche
21.1
/100
|
#203
Fair
95.8%
Assyrians/Chaldeans/Syriacs
20.5
/100
|
#204
Fair
95.8%
Moroccans
18.9
/100
|
#205
Poor
95.8%