Okinawan vs Alaska Native No Schooling Completed

COMPARE

Okinawan
Race
Ancestry
AfghanAfricanAlaskan AthabascanAlbanianAleutAlsatianAmericanApacheArabArapahoArgentineanArmenianAssyrian/Chaldean/SyriacAustralianAustrianBahamianBangladeshiBarbadianBasqueBelgianBelizeanBermudanBhutaneseBlackfeetBolivianBrazilianBritishBritish West IndianBulgarianBurmeseCajunCambodianCanadianCape VerdeanCarpatho RusynCelticCentral AmericanCentral American IndianCherokeeCheyenneChickasawChileanChineseChippewaChoctawColombianColvilleComancheCosta RicanCreeCreekCroatianCrowCubanCypriotCzechCzechoslovakianDanishDelawareDominicanDutchDutch West IndianEastern EuropeanEcuadorianEgyptianEnglishEstonianEthiopianEuropeanFijianFilipinoFinnishFrenchFrench American IndianFrench CanadianGermanGerman RussianGhanaianGreekGuamanian/ChamorroGuatemalanGuyaneseHaitianHmongHonduranHopiHoumaHungarianIcelanderIndian (Asian)IndonesianInupiatIranianIraqiIrishIroquoisIsraeliItalianJamaicanJapaneseJordanianKenyanKiowaKoreanLaotianLatvianLebaneseLiberianLithuanianLumbeeLuxembourgerMacedonianMalaysianMalteseMarshalleseMenomineeMexicanMexican American IndianMongolianMoroccanNative HawaiianNavajoNepaleseNew ZealanderNicaraguanNigerianNorthern EuropeanNorwegianOkinawanOsageOttawaPaiutePakistaniPalestinianPanamanianParaguayanPennsylvania GermanPeruvianPimaPolishPortuguesePotawatomiPuebloPuerto RicanPuget Sound SalishRomanianRussianSalvadoranSamoanScandinavianScotch-IrishScottishSeminoleSenegaleseSerbianShoshoneSierra LeoneanSiouxSlavicSlovakSloveneSomaliSouth AfricanSouth AmericanSouth American IndianSoviet UnionSpaniardSpanishSpanish AmericanSpanish American IndianSri LankanSubsaharan AfricanSudaneseSwedishSwissSyrianTaiwaneseThaiTlingit-HaidaTohono O'OdhamTonganTrinidadian and TobagonianTsimshianTurkishU.S. Virgin IslanderUgandanUkrainianUruguayanUteVenezuelanVietnameseWelshWest IndianYakamaYaquiYugoslavianYumanYup'ikZimbabwean
Immigration
NonimmigrantsImmigrantsAfghanistanAfricaAlbaniaArgentinaArmeniaAsiaAustraliaAustriaBahamasBangladeshBarbadosBelarusBelgiumBelizeBoliviaBosnia and HerzegovinaBrazilBulgariaBurma/MyanmarCabo VerdeCambodiaCameroonCanadaCaribbeanCentral AmericaChileChinaColombiaCongoCosta RicaCroatiaCubaCzechoslovakiaDenmarkDominicaDominican RepublicEastern AfricaEastern AsiaEastern EuropeEcuadorEgyptEl SalvadorEnglandEritreaEthiopiaEuropeFijiFranceGermanyGhanaGreeceGrenadaGuatemalaGuyanaHaitiHondurasHong KongHungaryIndiaIndonesiaIranIraqIrelandIsraelItalyJamaicaJapanJordanKazakhstanKenyaKoreaKuwaitLaosLatin AmericaLatviaLebanonLiberiaLithuaniaMalaysiaMexicoMicronesiaMiddle AfricaMoldovaMoroccoNepalNetherlandsNicaraguaNigeriaNorth AmericaNorth MacedoniaNorthern AfricaNorthern EuropeNorwayOceaniaPakistanPanamaPeruPhilippinesPolandPortugalRomaniaRussiaSaudi ArabiaScotlandSenegalSerbiaSierra LeoneSingaporeSomaliaSouth AfricaSouth AmericaSouth Central AsiaSouth Eastern AsiaSouthern EuropeSpainSri LankaSt. Vincent and the GrenadinesSudanSwedenSwitzerlandSyriaTaiwanThailandTrinidad and TobagoTurkeyUgandaUkraineUruguayUzbekistanVenezuelaVietnamWest IndiesWestern AfricaWestern AsiaWestern EuropeYemenZaireZimbabweAzores
Alaska Native
Race
Ancestry
AfghanAfricanAlaska NativeAlaskan AthabascanAlbanianAleutAlsatianAmericanApacheArabArapahoArgentineanArmenianAssyrian/Chaldean/SyriacAustralianAustrianBahamianBangladeshiBarbadianBasqueBelgianBelizeanBermudanBhutaneseBlackfeetBolivianBrazilianBritishBritish West IndianBulgarianBurmeseCajunCambodianCanadianCape VerdeanCarpatho RusynCelticCentral AmericanCentral American IndianCherokeeCheyenneChickasawChileanChineseChippewaChoctawColombianColvilleComancheCosta RicanCreeCreekCroatianCrowCubanCypriotCzechCzechoslovakianDanishDelawareDominicanDutchDutch West IndianEastern EuropeanEcuadorianEgyptianEnglishEstonianEthiopianEuropeanFijianFilipinoFinnishFrenchFrench American IndianFrench CanadianGermanGerman RussianGhanaianGreekGuamanian/ChamorroGuatemalanGuyaneseHaitianHmongHonduranHopiHoumaHungarianIcelanderIndian (Asian)IndonesianInupiatIranianIraqiIrishIroquoisIsraeliItalianJamaicanJapaneseJordanianKenyanKiowaKoreanLaotianLatvianLebaneseLiberianLithuanianLumbeeLuxembourgerMacedonianMalaysianMalteseMarshalleseMenomineeMexicanMexican American IndianMongolianMoroccanNative HawaiianNavajoNepaleseNew ZealanderNicaraguanNigerianNorthern EuropeanNorwegianOsageOttawaPaiutePakistaniPalestinianPanamanianParaguayanPennsylvania GermanPeruvianPimaPolishPortuguesePotawatomiPuebloPuerto RicanPuget Sound SalishRomanianRussianSalvadoranSamoanScandinavianScotch-IrishScottishSeminoleSenegaleseSerbianShoshoneSierra LeoneanSiouxSlavicSlovakSloveneSomaliSouth AfricanSouth AmericanSouth American IndianSoviet UnionSpaniardSpanishSpanish AmericanSpanish American IndianSri LankanSubsaharan AfricanSudaneseSwedishSwissSyrianTaiwaneseThaiTlingit-HaidaTohono O'OdhamTonganTrinidadian and TobagonianTsimshianTurkishU.S. Virgin IslanderUgandanUkrainianUruguayanUteVenezuelanVietnameseWelshWest IndianYakamaYaquiYugoslavianYumanYup'ikZimbabwean
Immigration
NonimmigrantsImmigrantsAfghanistanAfricaAlbaniaArgentinaArmeniaAsiaAustraliaAustriaBahamasBangladeshBarbadosBelarusBelgiumBelizeBoliviaBosnia and HerzegovinaBrazilBulgariaBurma/MyanmarCabo VerdeCambodiaCameroonCanadaCaribbeanCentral AmericaChileChinaColombiaCongoCosta RicaCroatiaCubaCzechoslovakiaDenmarkDominicaDominican RepublicEastern AfricaEastern AsiaEastern EuropeEcuadorEgyptEl SalvadorEnglandEritreaEthiopiaEuropeFijiFranceGermanyGhanaGreeceGrenadaGuatemalaGuyanaHaitiHondurasHong KongHungaryIndiaIndonesiaIranIraqIrelandIsraelItalyJamaicaJapanJordanKazakhstanKenyaKoreaKuwaitLaosLatin AmericaLatviaLebanonLiberiaLithuaniaMalaysiaMexicoMicronesiaMiddle AfricaMoldovaMoroccoNepalNetherlandsNicaraguaNigeriaNorth AmericaNorth MacedoniaNorthern AfricaNorthern EuropeNorwayOceaniaPakistanPanamaPeruPhilippinesPolandPortugalRomaniaRussiaSaudi ArabiaScotlandSenegalSerbiaSierra LeoneSingaporeSomaliaSouth AfricaSouth AmericaSouth Central AsiaSouth Eastern AsiaSouthern EuropeSpainSri LankaSt. Vincent and the GrenadinesSudanSwedenSwitzerlandSyriaTaiwanThailandTrinidad and TobagoTurkeyUgandaUkraineUruguayUzbekistanVenezuelaVietnamWest IndiesWestern AfricaWestern AsiaWestern EuropeYemenZaireZimbabweAzores
No Schooling Completed
Income
Poverty
Unemployment
Labor Participation
Family Structure
Vehicle Availability
Education Level
Disability

No Schooling Completed Comparison

Okinawans

Alaska Natives

Exceptional
Exceptional
1.8%
NO SCHOOLING COMPLETED
97.1/ 100
METRIC RATING
108th/ 347
METRIC RANK
1.5%
NO SCHOOLING COMPLETED
100.0/ 100
METRIC RATING
22nd/ 347
METRIC RANK

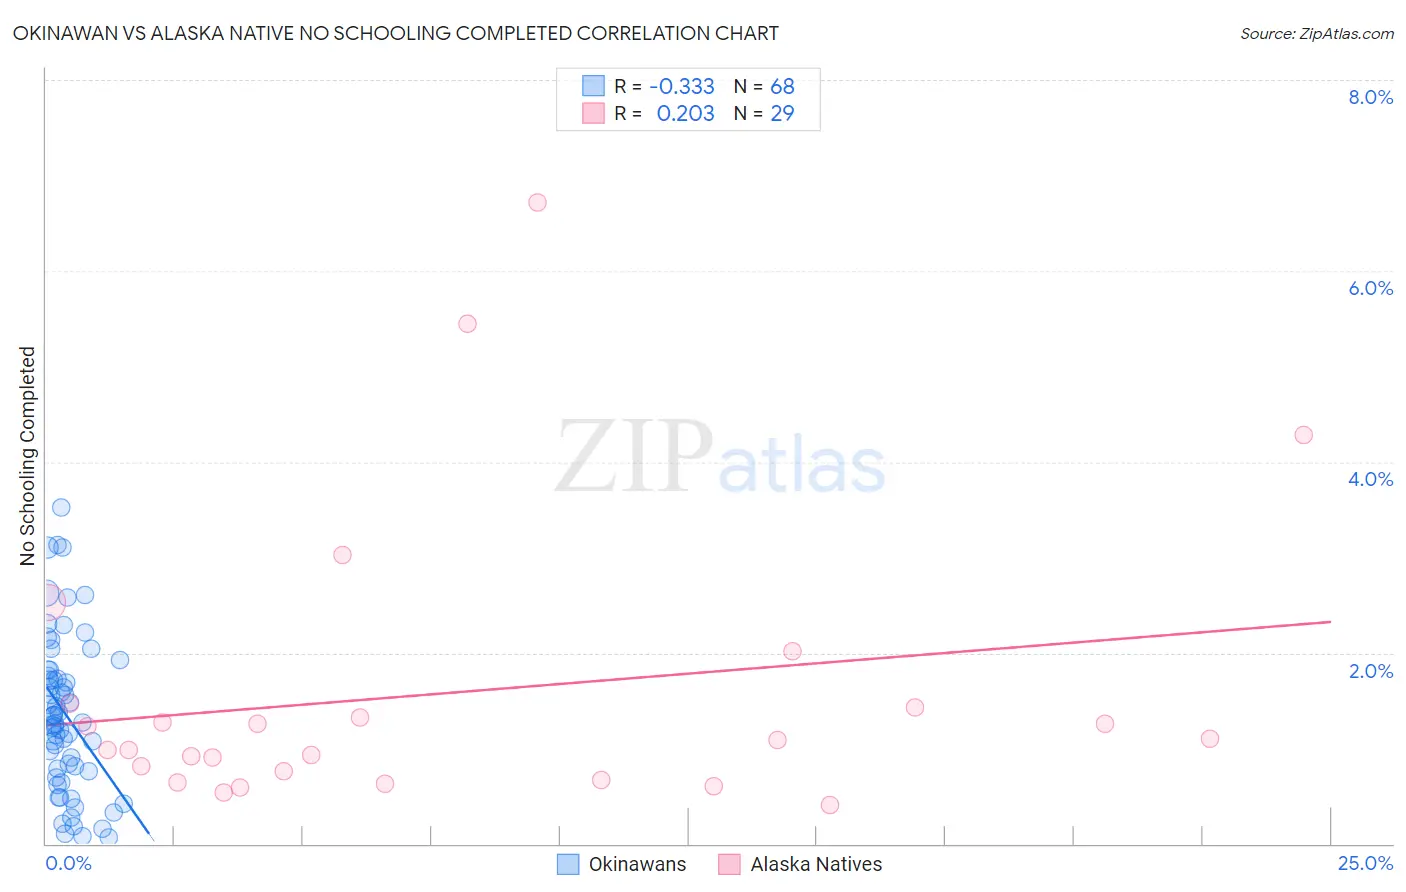
Okinawan vs Alaska Native No Schooling Completed Correlation Chart

The statistical analysis conducted on geographies consisting of 73,597,304 people shows a mild negative correlation between the proportion of Okinawans and percentage of population with no schooling in the United States with a correlation coefficient (R) of -0.333 and weighted average of 1.8%. Similarly, the statistical analysis conducted on geographies consisting of 76,332,603 people shows a weak positive correlation between the proportion of Alaska Natives and percentage of population with no schooling in the United States with a correlation coefficient (R) of 0.203 and weighted average of 1.5%, a difference of 25.2%.
Okinawan vs Alaska Native No Schooling Completed

No Schooling Completed Correlation Summary

MeasurementOkinawanAlaska Native
Minimum0.067%0.40%
Maximum3.5%6.7%
Range3.5%6.3%
Mean1.4%1.6%
Median1.3%1.1%
Interquartile 25% (IQ1)0.77%0.71%
Interquartile 75% (IQ3)1.8%1.4%
Interquartile Range (IQR)1.0%0.74%
Standard Deviation (Sample)0.81%1.5%
Standard Deviation (Population)0.80%1.5%

Similar Demographics by No Schooling Completed

Demographics Similar to Okinawans by No Schooling Completed

In terms of no schooling completed, the demographic groups most similar to Okinawans are Yugoslavian (1.8%, a difference of 0.22%), Immigrants from France (1.8%, a difference of 0.26%), Immigrants from Saudi Arabia (1.9%, a difference of 0.35%), Immigrants from Latvia (1.9%, a difference of 0.48%), and Immigrants from Japan (1.9%, a difference of 0.63%).
DemographicsRating | RankNo Schooling Completed
Immigrants | Czechoslovakia
97.9
/100
|
#101
Exceptional
1.8%
Immigrants | Switzerland
97.9
/100
|
#102
Exceptional
1.8%
Basques
97.9
/100
|
#103
Exceptional
1.8%
Thais
97.5
/100
|
#104
Exceptional
1.8%
German Russians
97.5
/100
|
#105
Exceptional
1.8%
Immigrants | France
97.3
/100
|
#106
Exceptional
1.8%
Yugoslavians
97.2
/100
|
#107
Exceptional
1.8%
Okinawans
97.1
/100
|
#108
Exceptional
1.8%
Immigrants | Saudi Arabia
96.8
/100
|
#109
Exceptional
1.9%
Immigrants | Latvia
96.7
/100
|
#110
Exceptional
1.9%
Immigrants | Japan
96.6
/100
|
#111
Exceptional
1.9%
Pueblo
96.4
/100
|
#112
Exceptional
1.9%
Immigrants | Zimbabwe
96.2
/100
|
#113
Exceptional
1.9%
Immigrants | Norway
96.1
/100
|
#114
Exceptional
1.9%
Syrians
96.0
/100
|
#115
Exceptional
1.9%

Demographics Similar to Alaska Natives by No Schooling Completed

In terms of no schooling completed, the demographic groups most similar to Alaska Natives are Chinese (1.5%, a difference of 0.090%), European (1.5%, a difference of 0.25%), Welsh (1.5%, a difference of 0.46%), Alaskan Athabascan (1.5%, a difference of 0.58%), and Pennsylvania German (1.5%, a difference of 0.61%).
DemographicsRating | RankNo Schooling Completed
Tlingit-Haida
100.0
/100
|
#15
Exceptional
1.5%
Finns
100.0
/100
|
#16
Exceptional
1.5%
Croatians
100.0
/100
|
#17
Exceptional
1.5%
Danes
100.0
/100
|
#18
Exceptional
1.5%
Alaskan Athabascans
100.0
/100
|
#19
Exceptional
1.5%
Welsh
100.0
/100
|
#20
Exceptional
1.5%
Chinese
100.0
/100
|
#21
Exceptional
1.5%
Alaska Natives
100.0
/100
|
#22
Exceptional
1.5%
Europeans
100.0
/100
|
#23
Exceptional
1.5%
Pennsylvania Germans
100.0
/100
|
#24
Exceptional
1.5%
French
100.0
/100
|
#25
Exceptional
1.5%
Czechs
100.0
/100
|
#26
Exceptional
1.5%
Scandinavians
100.0
/100
|
#27
Exceptional
1.5%
French Canadians
100.0
/100
|
#28
Exceptional
1.5%
Lumbee
100.0
/100
|
#29
Exceptional
1.5%