Lebanese vs Immigrants from Western Asia Associate's Degree

COMPARE

Lebanese
Race
Ancestry
AfghanAfricanAlaska NativeAlaskan AthabascanAlbanianAleutAlsatianAmericanApacheArabArapahoArgentineanArmenianAssyrian/Chaldean/SyriacAustralianAustrianBahamianBangladeshiBarbadianBasqueBelgianBelizeanBermudanBhutaneseBlackfeetBolivianBrazilianBritishBritish West IndianBulgarianBurmeseCajunCambodianCanadianCape VerdeanCarpatho RusynCelticCentral AmericanCentral American IndianCherokeeCheyenneChickasawChileanChineseChippewaChoctawColombianColvilleComancheCosta RicanCreeCreekCroatianCrowCubanCypriotCzechCzechoslovakianDanishDelawareDominicanDutchDutch West IndianEastern EuropeanEcuadorianEgyptianEnglishEstonianEthiopianEuropeanFijianFilipinoFinnishFrenchFrench American IndianFrench CanadianGermanGerman RussianGhanaianGreekGuamanian/ChamorroGuatemalanGuyaneseHaitianHmongHonduranHopiHoumaHungarianIcelanderIndian (Asian)IndonesianInupiatIranianIraqiIrishIroquoisIsraeliItalianJamaicanJapaneseJordanianKenyanKiowaKoreanLaotianLatvianLebaneseLiberianLithuanianLumbeeLuxembourgerMacedonianMalaysianMalteseMarshalleseMenomineeMexicanMexican American IndianMongolianMoroccanNative HawaiianNavajoNepaleseNew ZealanderNicaraguanNigerianNorthern EuropeanNorwegianOkinawanOsageOttawaPaiutePakistaniPalestinianPanamanianParaguayanPennsylvania GermanPeruvianPimaPolishPortuguesePotawatomiPuebloPuerto RicanPuget Sound SalishRomanianRussianSalvadoranSamoanScandinavianScotch-IrishScottishSeminoleSenegaleseSerbianShoshoneSierra LeoneanSiouxSlavicSlovakSloveneSomaliSouth AfricanSouth AmericanSouth American IndianSoviet UnionSpaniardSpanishSpanish AmericanSpanish American IndianSri LankanSubsaharan AfricanSudaneseSwedishSwissSyrianTaiwaneseThaiTlingit-HaidaTohono O'OdhamTonganTrinidadian and TobagonianTsimshianTurkishU.S. Virgin IslanderUgandanUkrainianUruguayanUteVenezuelanVietnameseWelshWest IndianYakamaYaquiYugoslavianYumanYup'ikZimbabwean
Immigration
NonimmigrantsImmigrantsAfghanistanAfricaAlbaniaArgentinaArmeniaAsiaAustraliaAustriaBahamasBangladeshBarbadosBelarusBelgiumBelizeBoliviaBosnia and HerzegovinaBrazilBulgariaBurma/MyanmarCabo VerdeCambodiaCameroonCanadaCaribbeanCentral AmericaChileChinaColombiaCongoCosta RicaCroatiaCubaCzechoslovakiaDenmarkDominicaDominican RepublicEastern AfricaEastern AsiaEastern EuropeEcuadorEgyptEl SalvadorEnglandEritreaEthiopiaEuropeFijiFranceGermanyGhanaGreeceGrenadaGuatemalaGuyanaHaitiHondurasHong KongHungaryIndiaIndonesiaIranIraqIrelandIsraelItalyJamaicaJapanJordanKazakhstanKenyaKoreaKuwaitLaosLatin AmericaLatviaLebanonLiberiaLithuaniaMalaysiaMexicoMicronesiaMiddle AfricaMoldovaMoroccoNepalNetherlandsNicaraguaNigeriaNorth AmericaNorth MacedoniaNorthern AfricaNorthern EuropeNorwayOceaniaPakistanPanamaPeruPhilippinesPolandPortugalRomaniaRussiaSaudi ArabiaScotlandSenegalSerbiaSierra LeoneSingaporeSomaliaSouth AfricaSouth AmericaSouth Central AsiaSouth Eastern AsiaSouthern EuropeSpainSri LankaSt. Vincent and the GrenadinesSudanSwedenSwitzerlandSyriaTaiwanThailandTrinidad and TobagoTurkeyUgandaUkraineUruguayUzbekistanVenezuelaVietnamWest IndiesWestern AfricaWestern EuropeYemenZaireZimbabweAzores
Immigrants from Western Asia
Race
Ancestry
AfghanAfricanAlaska NativeAlaskan AthabascanAlbanianAleutAlsatianAmericanApacheArabArapahoArgentineanArmenianAssyrian/Chaldean/SyriacAustralianAustrianBahamianBangladeshiBarbadianBasqueBelgianBelizeanBermudanBhutaneseBlackfeetBolivianBrazilianBritishBritish West IndianBulgarianBurmeseCajunCambodianCanadianCape VerdeanCarpatho RusynCelticCentral AmericanCentral American IndianCherokeeCheyenneChickasawChileanChineseChippewaChoctawColombianColvilleComancheCosta RicanCreeCreekCroatianCrowCubanCypriotCzechCzechoslovakianDanishDelawareDominicanDutchDutch West IndianEastern EuropeanEcuadorianEgyptianEnglishEstonianEthiopianEuropeanFijianFilipinoFinnishFrenchFrench American IndianFrench CanadianGermanGerman RussianGhanaianGreekGuamanian/ChamorroGuatemalanGuyaneseHaitianHmongHonduranHopiHoumaHungarianIcelanderIndian (Asian)IndonesianInupiatIranianIraqiIrishIroquoisIsraeliItalianJamaicanJapaneseJordanianKenyanKiowaKoreanLaotianLatvianLiberianLithuanianLumbeeLuxembourgerMacedonianMalaysianMalteseMarshalleseMenomineeMexicanMexican American IndianMongolianMoroccanNative HawaiianNavajoNepaleseNew ZealanderNicaraguanNigerianNorthern EuropeanNorwegianOkinawanOsageOttawaPaiutePakistaniPalestinianPanamanianParaguayanPennsylvania GermanPeruvianPimaPolishPortuguesePotawatomiPuebloPuerto RicanPuget Sound SalishRomanianRussianSalvadoranSamoanScandinavianScotch-IrishScottishSeminoleSenegaleseSerbianShoshoneSierra LeoneanSiouxSlavicSlovakSloveneSomaliSouth AfricanSouth AmericanSouth American IndianSoviet UnionSpaniardSpanishSpanish AmericanSpanish American IndianSri LankanSubsaharan AfricanSudaneseSwedishSwissSyrianTaiwaneseThaiTlingit-HaidaTohono O'OdhamTonganTrinidadian and TobagonianTsimshianTurkishU.S. Virgin IslanderUgandanUkrainianUruguayanUteVenezuelanVietnameseWelshWest IndianYakamaYaquiYugoslavianYumanYup'ikZimbabwean
Immigration
NonimmigrantsImmigrantsAfghanistanAfricaAlbaniaArgentinaArmeniaAsiaAustraliaAustriaBahamasBangladeshBarbadosBelarusBelgiumBelizeBoliviaBosnia and HerzegovinaBrazilBulgariaBurma/MyanmarCabo VerdeCambodiaCameroonCanadaCaribbeanCentral AmericaChileChinaColombiaCongoCosta RicaCroatiaCubaCzechoslovakiaDenmarkDominicaDominican RepublicEastern AfricaEastern AsiaEastern EuropeEcuadorEgyptEl SalvadorEnglandEritreaEthiopiaEuropeFijiFranceGermanyGhanaGreeceGrenadaGuatemalaGuyanaHaitiHondurasHong KongHungaryIndiaIndonesiaIranIraqIrelandIsraelItalyJamaicaJapanJordanKazakhstanKenyaKoreaKuwaitLaosLatin AmericaLatviaLebanonLiberiaLithuaniaMalaysiaMexicoMicronesiaMiddle AfricaMoldovaMoroccoNepalNetherlandsNicaraguaNigeriaNorth AmericaNorth MacedoniaNorthern AfricaNorthern EuropeNorwayOceaniaPakistanPanamaPeruPhilippinesPolandPortugalRomaniaRussiaSaudi ArabiaScotlandSenegalSerbiaSierra LeoneSingaporeSomaliaSouth AfricaSouth AmericaSouth Central AsiaSouth Eastern AsiaSouthern EuropeSpainSri LankaSt. Vincent and the GrenadinesSudanSwedenSwitzerlandSyriaTaiwanThailandTrinidad and TobagoTurkeyUgandaUkraineUruguayUzbekistanVenezuelaVietnamWest IndiesWestern AfricaWestern AsiaWestern EuropeYemenZaireZimbabweAzores
Associate's Degree
Income
Poverty
Unemployment
Labor Participation
Family Structure
Vehicle Availability
Education Level
Disability

Associate's Degree Comparison

Lebanese

Immigrants from Western Asia

Exceptional
Exceptional
48.8%
ASSOCIATE'S DEGREE
94.6/ 100
METRIC RATING
119th/ 347
METRIC RANK
50.1%
ASSOCIATE'S DEGREE
98.7/ 100
METRIC RATING
91st/ 347
METRIC RANK

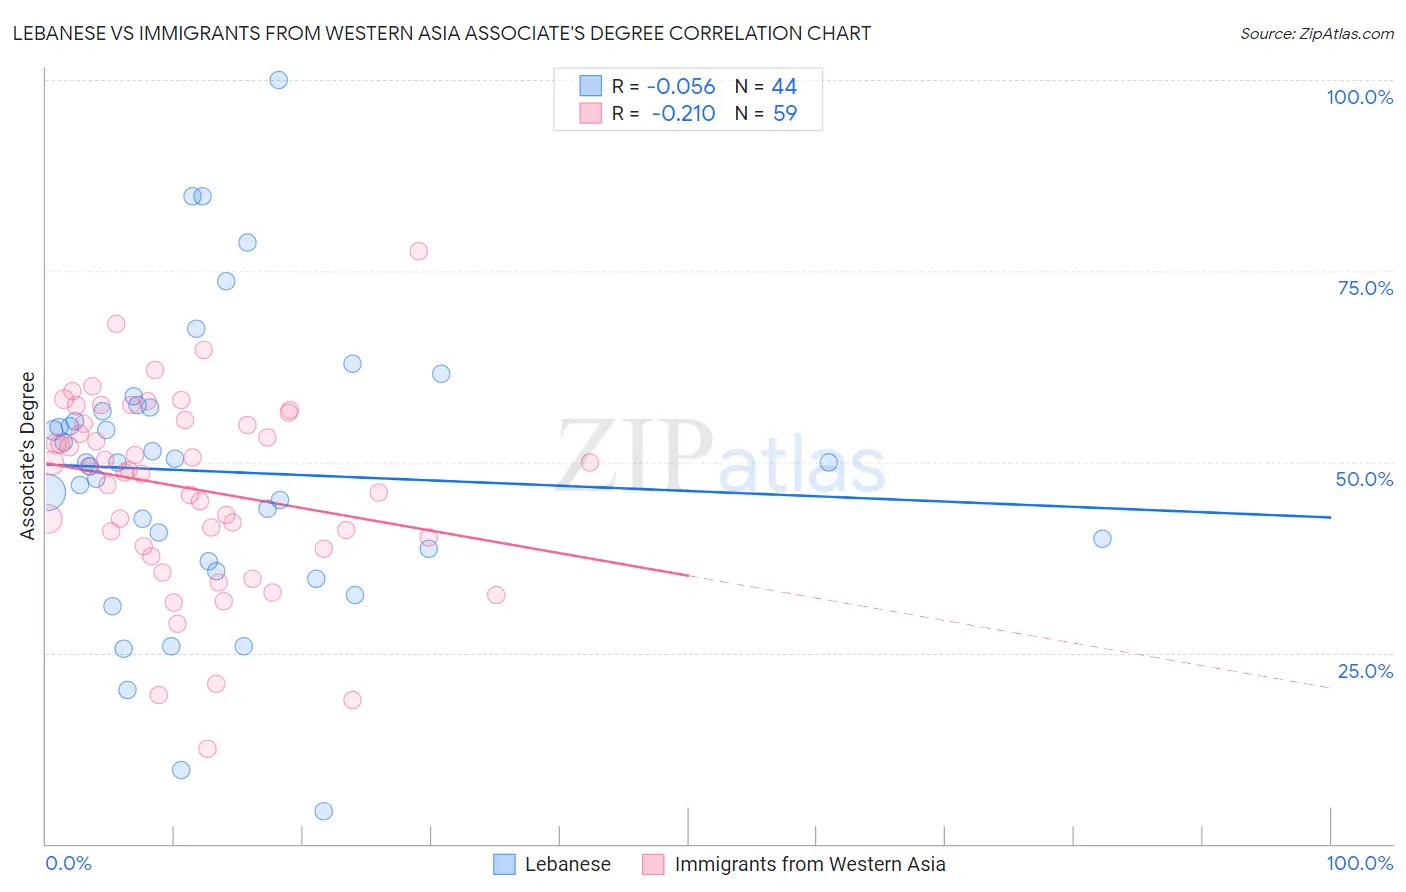
Lebanese vs Immigrants from Western Asia Associate's Degree Correlation Chart

The statistical analysis conducted on geographies consisting of 401,605,631 people shows a slight negative correlation between the proportion of Lebanese and percentage of population with at least associate's degree education in the United States with a correlation coefficient (R) of -0.056 and weighted average of 48.8%. Similarly, the statistical analysis conducted on geographies consisting of 404,416,619 people shows a weak negative correlation between the proportion of Immigrants from Western Asia and percentage of population with at least associate's degree education in the United States with a correlation coefficient (R) of -0.210 and weighted average of 50.1%, a difference of 2.5%.
Lebanese vs Immigrants from Western Asia Associate's Degree

Associate's Degree Correlation Summary

MeasurementLebaneseImmigrants from Western Asia
Minimum4.3%12.5%
Maximum100.0%77.6%
Range95.7%65.1%
Mean48.7%46.5%
Median49.9%48.9%
Interquartile 25% (IQ1)37.8%38.9%
Interquartile 75% (IQ3)56.9%55.4%
Interquartile Range (IQR)19.1%16.5%
Standard Deviation (Sample)18.8%12.5%
Standard Deviation (Population)18.6%12.4%

Similar Demographics by Associate's Degree

Demographics Similar to Lebanese by Associate's Degree

In terms of associate's degree, the demographic groups most similar to Lebanese are Albanian (48.8%, a difference of 0.010%), Alsatian (48.8%, a difference of 0.020%), Afghan (48.9%, a difference of 0.070%), British (48.9%, a difference of 0.12%), and Luxembourger (48.9%, a difference of 0.18%).
DemographicsRating | RankAssociate's Degree
Immigrants | Chile
95.3
/100
|
#112
Exceptional
49.0%
Palestinians
95.3
/100
|
#113
Exceptional
49.0%
Arabs
95.3
/100
|
#114
Exceptional
49.0%
Luxembourgers
95.1
/100
|
#115
Exceptional
48.9%
British
95.0
/100
|
#116
Exceptional
48.9%
Afghans
94.8
/100
|
#117
Exceptional
48.9%
Albanians
94.7
/100
|
#118
Exceptional
48.8%
Lebanese
94.6
/100
|
#119
Exceptional
48.8%
Alsatians
94.6
/100
|
#120
Exceptional
48.8%
Ugandans
93.9
/100
|
#121
Exceptional
48.7%
Italians
93.9
/100
|
#122
Exceptional
48.7%
Brazilians
93.7
/100
|
#123
Exceptional
48.7%
Serbians
92.6
/100
|
#124
Exceptional
48.5%
Chinese
92.5
/100
|
#125
Exceptional
48.5%
Immigrants | Syria
92.2
/100
|
#126
Exceptional
48.5%

Demographics Similar to Immigrants from Western Asia by Associate's Degree

In terms of associate's degree, the demographic groups most similar to Immigrants from Western Asia are Immigrants from North America (50.1%, a difference of 0.020%), Immigrants from Western Europe (50.1%, a difference of 0.080%), Immigrants from Ethiopia (50.1%, a difference of 0.080%), Immigrants from Canada (50.1%, a difference of 0.090%), and Immigrants from Moldova (50.2%, a difference of 0.16%).
DemographicsRating | RankAssociate's Degree
Immigrants | Hungary
98.9
/100
|
#84
Exceptional
50.2%
Immigrants | Egypt
98.9
/100
|
#85
Exceptional
50.2%
Immigrants | Croatia
98.9
/100
|
#86
Exceptional
50.2%
Immigrants | Moldova
98.8
/100
|
#87
Exceptional
50.2%
Immigrants | Canada
98.7
/100
|
#88
Exceptional
50.1%
Immigrants | Western Europe
98.7
/100
|
#89
Exceptional
50.1%
Immigrants | Ethiopia
98.7
/100
|
#90
Exceptional
50.1%
Immigrants | Western Asia
98.7
/100
|
#91
Exceptional
50.1%
Immigrants | North America
98.7
/100
|
#92
Exceptional
50.1%
Immigrants | Brazil
98.5
/100
|
#93
Exceptional
50.0%
Laotians
98.4
/100
|
#94
Exceptional
49.9%
Immigrants | England
98.0
/100
|
#95
Exceptional
49.7%
Romanians
98.0
/100
|
#96
Exceptional
49.7%
Immigrants | Ukraine
98.0
/100
|
#97
Exceptional
49.7%
Immigrants | Northern Africa
97.9
/100
|
#98
Exceptional
49.7%