Lebanese vs French American Indian Associate's Degree
COMPARE
Lebanese
French American Indian
Associate's Degree
Associate's Degree Comparison
Lebanese
French American Indians
48.8%
ASSOCIATE'S DEGREE
94.6/ 100
METRIC RATING
119th/ 347
METRIC RANK
42.0%
ASSOCIATE'S DEGREE
0.6/ 100
METRIC RATING
252nd/ 347
METRIC RANK
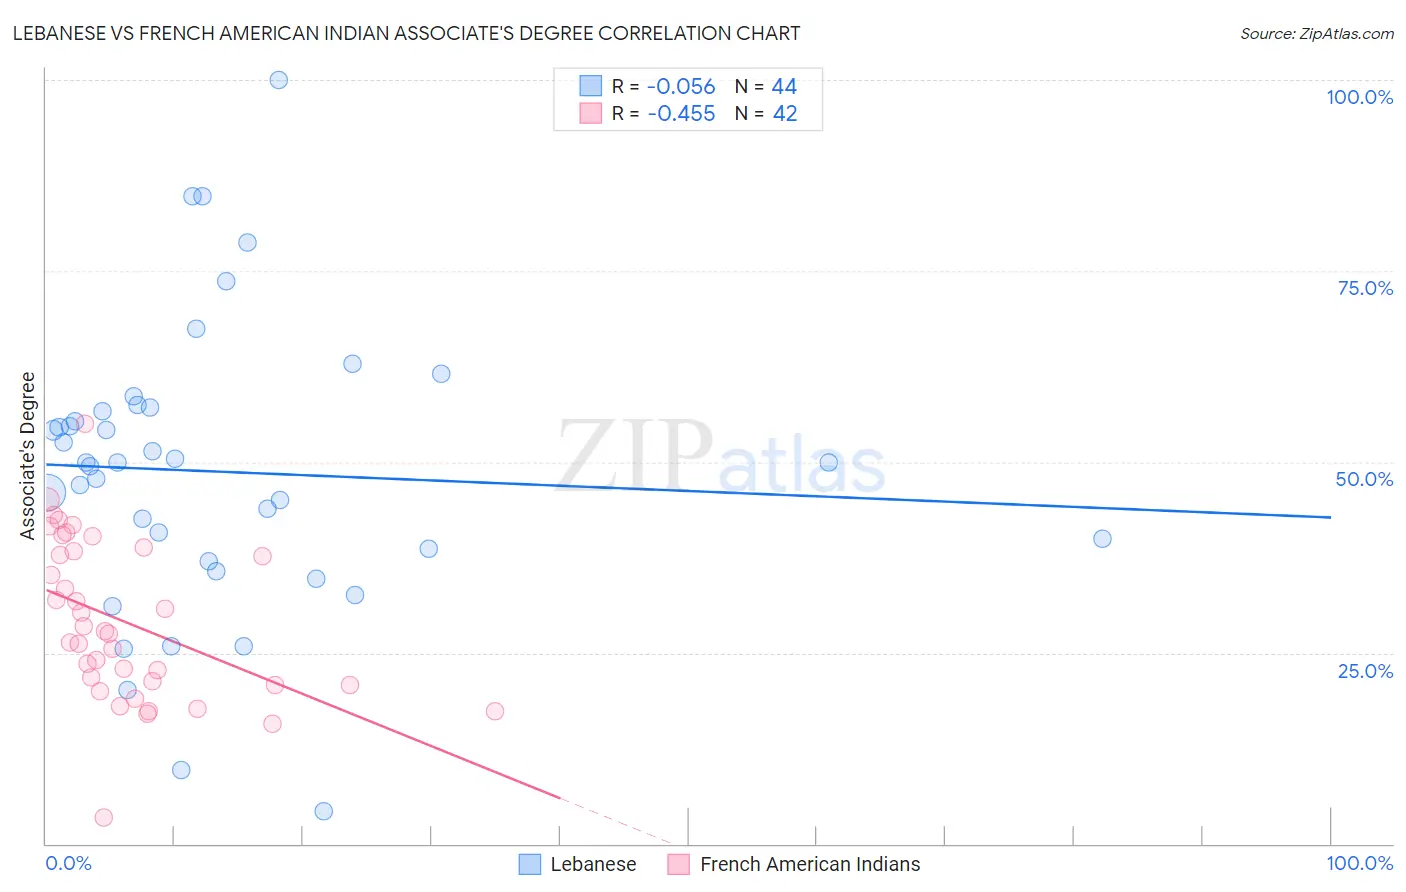
Lebanese vs French American Indian Associate's Degree Correlation Chart
The statistical analysis conducted on geographies consisting of 401,605,631 people shows a slight negative correlation between the proportion of Lebanese and percentage of population with at least associate's degree education in the United States with a correlation coefficient (R) of -0.056 and weighted average of 48.8%. Similarly, the statistical analysis conducted on geographies consisting of 131,974,565 people shows a moderate negative correlation between the proportion of French American Indians and percentage of population with at least associate's degree education in the United States with a correlation coefficient (R) of -0.455 and weighted average of 42.0%, a difference of 16.4%.
Associate's Degree Correlation Summary
| Measurement | Lebanese | French American Indian |
| Minimum | 4.3% | 3.4% |
| Maximum | 100.0% | 55.0% |
| Range | 95.7% | 51.5% |
| Mean | 48.7% | 29.1% |
| Median | 49.9% | 27.6% |
| Interquartile 25% (IQ1) | 37.8% | 20.8% |
| Interquartile 75% (IQ3) | 56.9% | 38.3% |
| Interquartile Range (IQR) | 19.1% | 17.5% |
| Standard Deviation (Sample) | 18.8% | 10.5% |
| Standard Deviation (Population) | 18.6% | 10.4% |
Similar Demographics by Associate's Degree
Demographics Similar to Lebanese by Associate's Degree
In terms of associate's degree, the demographic groups most similar to Lebanese are Albanian (48.8%, a difference of 0.010%), Alsatian (48.8%, a difference of 0.020%), Afghan (48.9%, a difference of 0.070%), British (48.9%, a difference of 0.12%), and Luxembourger (48.9%, a difference of 0.18%).
| Demographics | Rating | Rank | Associate's Degree |
| Immigrants | Chile | 95.3 /100 | #112 | Exceptional 49.0% |
| Palestinians | 95.3 /100 | #113 | Exceptional 49.0% |
| Arabs | 95.3 /100 | #114 | Exceptional 49.0% |
| Luxembourgers | 95.1 /100 | #115 | Exceptional 48.9% |
| British | 95.0 /100 | #116 | Exceptional 48.9% |
| Afghans | 94.8 /100 | #117 | Exceptional 48.9% |
| Albanians | 94.7 /100 | #118 | Exceptional 48.8% |
| Lebanese | 94.6 /100 | #119 | Exceptional 48.8% |
| Alsatians | 94.6 /100 | #120 | Exceptional 48.8% |
| Ugandans | 93.9 /100 | #121 | Exceptional 48.7% |
| Italians | 93.9 /100 | #122 | Exceptional 48.7% |
| Brazilians | 93.7 /100 | #123 | Exceptional 48.7% |
| Serbians | 92.6 /100 | #124 | Exceptional 48.5% |
| Chinese | 92.5 /100 | #125 | Exceptional 48.5% |
| Immigrants | Syria | 92.2 /100 | #126 | Exceptional 48.5% |
Demographics Similar to French American Indians by Associate's Degree
In terms of associate's degree, the demographic groups most similar to French American Indians are Indonesian (41.9%, a difference of 0.10%), Cuban (41.9%, a difference of 0.17%), Immigrants from Guyana (41.8%, a difference of 0.25%), Immigrants from Bahamas (42.1%, a difference of 0.36%), and U.S. Virgin Islander (42.1%, a difference of 0.38%).
| Demographics | Rating | Rank | Associate's Degree |
| Immigrants | Cambodia | 0.9 /100 | #245 | Tragic 42.3% |
| Delaware | 0.9 /100 | #246 | Tragic 42.3% |
| Immigrants | Fiji | 0.8 /100 | #247 | Tragic 42.2% |
| Immigrants | Ecuador | 0.8 /100 | #248 | Tragic 42.2% |
| Jamaicans | 0.7 /100 | #249 | Tragic 42.1% |
| U.S. Virgin Islanders | 0.7 /100 | #250 | Tragic 42.1% |
| Immigrants | Bahamas | 0.7 /100 | #251 | Tragic 42.1% |
| French American Indians | 0.6 /100 | #252 | Tragic 42.0% |
| Indonesians | 0.6 /100 | #253 | Tragic 41.9% |
| Cubans | 0.6 /100 | #254 | Tragic 41.9% |
| Immigrants | Guyana | 0.5 /100 | #255 | Tragic 41.8% |
| Immigrants | Congo | 0.5 /100 | #256 | Tragic 41.8% |
| Spanish Americans | 0.5 /100 | #257 | Tragic 41.8% |
| Japanese | 0.5 /100 | #258 | Tragic 41.7% |
| Malaysians | 0.4 /100 | #259 | Tragic 41.6% |