Latvian vs Immigrants from Western Europe High School Diploma
COMPARE
Latvian
Immigrants from Western Europe
High School Diploma
High School Diploma Comparison
Latvians
Immigrants from Western Europe
92.0%
HIGH SCHOOL DIPLOMA
100.0/ 100
METRIC RATING
9th/ 347
METRIC RANK
90.6%
HIGH SCHOOL DIPLOMA
98.6/ 100
METRIC RATING
93rd/ 347
METRIC RANK
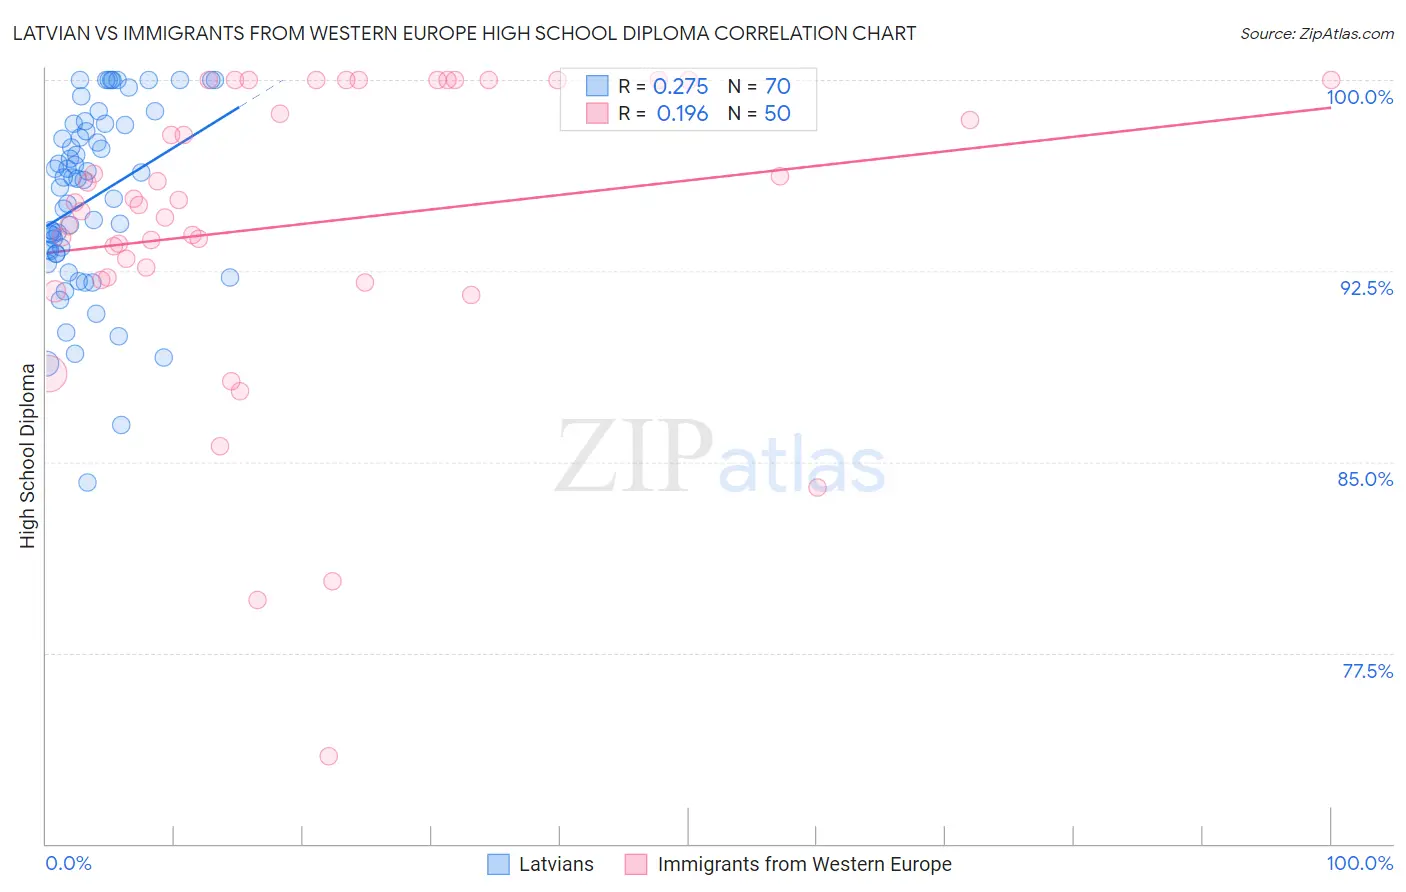
Latvian vs Immigrants from Western Europe High School Diploma Correlation Chart
The statistical analysis conducted on geographies consisting of 220,726,693 people shows a weak positive correlation between the proportion of Latvians and percentage of population with at least high school diploma education in the United States with a correlation coefficient (R) of 0.275 and weighted average of 92.0%. Similarly, the statistical analysis conducted on geographies consisting of 494,080,377 people shows a poor positive correlation between the proportion of Immigrants from Western Europe and percentage of population with at least high school diploma education in the United States with a correlation coefficient (R) of 0.196 and weighted average of 90.6%, a difference of 1.6%.
High School Diploma Correlation Summary
| Measurement | Latvian | Immigrants from Western Europe |
| Minimum | 84.2% | 73.4% |
| Maximum | 100.0% | 100.0% |
| Range | 15.8% | 26.6% |
| Mean | 95.3% | 94.3% |
| Median | 96.1% | 95.1% |
| Interquartile 25% (IQ1) | 93.2% | 92.3% |
| Interquartile 75% (IQ3) | 98.2% | 100.0% |
| Interquartile Range (IQR) | 5.1% | 7.7% |
| Standard Deviation (Sample) | 3.6% | 5.9% |
| Standard Deviation (Population) | 3.5% | 5.9% |
Similar Demographics by High School Diploma
Demographics Similar to Latvians by High School Diploma
In terms of high school diploma, the demographic groups most similar to Latvians are Chinese (92.0%, a difference of 0.010%), Slovak (92.0%, a difference of 0.030%), Immigrants from India (92.0%, a difference of 0.030%), Croatian (92.0%, a difference of 0.030%), and Lithuanian (92.0%, a difference of 0.050%).
| Demographics | Rating | Rank | High School Diploma |
| Swedes | 100.0 /100 | #2 | Exceptional 92.2% |
| Carpatho Rusyns | 100.0 /100 | #3 | Exceptional 92.1% |
| Lithuanians | 100.0 /100 | #4 | Exceptional 92.0% |
| Slovenes | 100.0 /100 | #5 | Exceptional 92.0% |
| Slovaks | 100.0 /100 | #6 | Exceptional 92.0% |
| Immigrants | India | 100.0 /100 | #7 | Exceptional 92.0% |
| Chinese | 100.0 /100 | #8 | Exceptional 92.0% |
| Latvians | 100.0 /100 | #9 | Exceptional 92.0% |
| Croatians | 100.0 /100 | #10 | Exceptional 92.0% |
| Eastern Europeans | 100.0 /100 | #11 | Exceptional 91.9% |
| Poles | 100.0 /100 | #12 | Exceptional 91.9% |
| Danes | 100.0 /100 | #13 | Exceptional 91.8% |
| Bulgarians | 100.0 /100 | #14 | Exceptional 91.8% |
| Luxembourgers | 100.0 /100 | #15 | Exceptional 91.7% |
| Finns | 100.0 /100 | #16 | Exceptional 91.7% |
Demographics Similar to Immigrants from Western Europe by High School Diploma
In terms of high school diploma, the demographic groups most similar to Immigrants from Western Europe are Swiss (90.6%, a difference of 0.0%), South African (90.6%, a difference of 0.020%), Immigrants from Israel (90.5%, a difference of 0.020%), Icelander (90.5%, a difference of 0.020%), and Canadian (90.6%, a difference of 0.040%).
| Demographics | Rating | Rank | High School Diploma |
| Immigrants | Bulgaria | 98.9 /100 | #86 | Exceptional 90.6% |
| Immigrants | Turkey | 98.9 /100 | #87 | Exceptional 90.6% |
| Immigrants | France | 98.8 /100 | #88 | Exceptional 90.6% |
| Canadians | 98.7 /100 | #89 | Exceptional 90.6% |
| Celtics | 98.7 /100 | #90 | Exceptional 90.6% |
| South Africans | 98.6 /100 | #91 | Exceptional 90.6% |
| Swiss | 98.6 /100 | #92 | Exceptional 90.6% |
| Immigrants | Western Europe | 98.6 /100 | #93 | Exceptional 90.6% |
| Immigrants | Israel | 98.5 /100 | #94 | Exceptional 90.5% |
| Icelanders | 98.5 /100 | #95 | Exceptional 90.5% |
| Immigrants | Serbia | 98.4 /100 | #96 | Exceptional 90.5% |
| Immigrants | Kuwait | 98.3 /100 | #97 | Exceptional 90.5% |
| Immigrants | Korea | 98.3 /100 | #98 | Exceptional 90.5% |
| Immigrants | Europe | 98.2 /100 | #99 | Exceptional 90.5% |
| Immigrants | North Macedonia | 98.1 /100 | #100 | Exceptional 90.5% |