Iroquois vs Immigrants from Honduras No Schooling Completed
COMPARE
Iroquois
Immigrants from Honduras
No Schooling Completed
No Schooling Completed Comparison
Iroquois
Immigrants from Honduras
1.9%
NO SCHOOLING COMPLETED
95.1/ 100
METRIC RATING
119th/ 347
METRIC RANK
3.2%
NO SCHOOLING COMPLETED
0.0/ 100
METRIC RATING
322nd/ 347
METRIC RANK
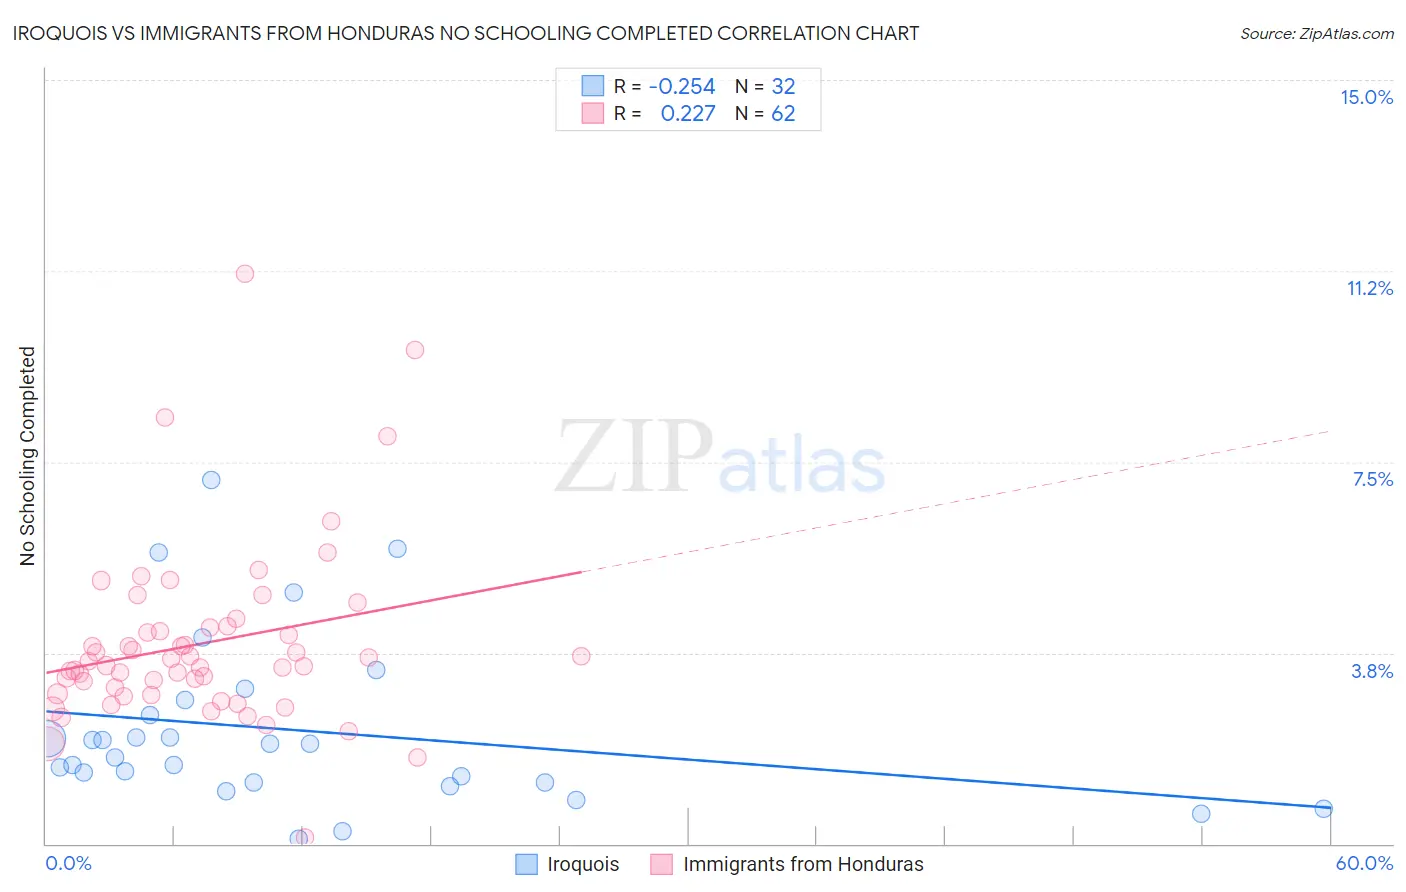
Iroquois vs Immigrants from Honduras No Schooling Completed Correlation Chart
The statistical analysis conducted on geographies consisting of 205,850,769 people shows a weak negative correlation between the proportion of Iroquois and percentage of population with no schooling in the United States with a correlation coefficient (R) of -0.254 and weighted average of 1.9%. Similarly, the statistical analysis conducted on geographies consisting of 321,294,149 people shows a weak positive correlation between the proportion of Immigrants from Honduras and percentage of population with no schooling in the United States with a correlation coefficient (R) of 0.227 and weighted average of 3.2%, a difference of 68.4%.
No Schooling Completed Correlation Summary
| Measurement | Iroquois | Immigrants from Honduras |
| Minimum | 0.10% | 0.12% |
| Maximum | 7.1% | 11.2% |
| Range | 7.0% | 11.1% |
| Mean | 2.2% | 3.9% |
| Median | 1.8% | 3.5% |
| Interquartile 25% (IQ1) | 1.2% | 2.9% |
| Interquartile 75% (IQ3) | 2.7% | 4.3% |
| Interquartile Range (IQR) | 1.5% | 1.3% |
| Standard Deviation (Sample) | 1.7% | 1.8% |
| Standard Deviation (Population) | 1.6% | 1.8% |
Similar Demographics by No Schooling Completed
Demographics Similar to Iroquois by No Schooling Completed
In terms of no schooling completed, the demographic groups most similar to Iroquois are Spanish (1.9%, a difference of 0.35%), Immigrants from Bulgaria (1.9%, a difference of 0.40%), Immigrants from Croatia (1.9%, a difference of 0.47%), Cree (1.9%, a difference of 0.50%), and Immigrants from Serbia (1.9%, a difference of 0.58%).
| Demographics | Rating | Rank | No Schooling Completed |
| Pueblo | 96.4 /100 | #112 | Exceptional 1.9% |
| Immigrants | Zimbabwe | 96.2 /100 | #113 | Exceptional 1.9% |
| Immigrants | Norway | 96.1 /100 | #114 | Exceptional 1.9% |
| Syrians | 96.0 /100 | #115 | Exceptional 1.9% |
| Lebanese | 96.0 /100 | #116 | Exceptional 1.9% |
| Immigrants | Serbia | 95.8 /100 | #117 | Exceptional 1.9% |
| Spanish | 95.5 /100 | #118 | Exceptional 1.9% |
| Iroquois | 95.1 /100 | #119 | Exceptional 1.9% |
| Immigrants | Bulgaria | 94.6 /100 | #120 | Exceptional 1.9% |
| Immigrants | Croatia | 94.5 /100 | #121 | Exceptional 1.9% |
| Cree | 94.5 /100 | #122 | Exceptional 1.9% |
| Immigrants | Kuwait | 93.9 /100 | #123 | Exceptional 1.9% |
| Cambodians | 93.8 /100 | #124 | Exceptional 1.9% |
| Immigrants | Europe | 93.7 /100 | #125 | Exceptional 1.9% |
| Immigrants | Romania | 92.6 /100 | #126 | Exceptional 1.9% |
Demographics Similar to Immigrants from Honduras by No Schooling Completed
In terms of no schooling completed, the demographic groups most similar to Immigrants from Honduras are Vietnamese (3.2%, a difference of 0.19%), Mexican American Indian (3.2%, a difference of 0.53%), Immigrants from Laos (3.1%, a difference of 0.67%), Immigrants from Bangladesh (3.1%, a difference of 0.79%), and Immigrants from Burma/Myanmar (3.1%, a difference of 0.83%).
| Demographics | Rating | Rank | No Schooling Completed |
| Immigrants | Nicaragua | 0.0 /100 | #315 | Tragic 3.1% |
| Immigrants | Ecuador | 0.0 /100 | #316 | Tragic 3.1% |
| Cape Verdeans | 0.0 /100 | #317 | Tragic 3.1% |
| Immigrants | Guyana | 0.0 /100 | #318 | Tragic 3.1% |
| Immigrants | Burma/Myanmar | 0.0 /100 | #319 | Tragic 3.1% |
| Immigrants | Bangladesh | 0.0 /100 | #320 | Tragic 3.1% |
| Immigrants | Laos | 0.0 /100 | #321 | Tragic 3.1% |
| Immigrants | Honduras | 0.0 /100 | #322 | Tragic 3.2% |
| Vietnamese | 0.0 /100 | #323 | Tragic 3.2% |
| Mexican American Indians | 0.0 /100 | #324 | Tragic 3.2% |
| Dominicans | 0.0 /100 | #325 | Tragic 3.2% |
| Indonesians | 0.0 /100 | #326 | Tragic 3.2% |
| Immigrants | Latin America | 0.0 /100 | #327 | Tragic 3.3% |
| Mexicans | 0.0 /100 | #328 | Tragic 3.3% |
| Immigrants | Vietnam | 0.0 /100 | #329 | Tragic 3.3% |