Indonesian vs Immigrants from Dominica No Schooling Completed
COMPARE
Indonesian
Immigrants from Dominica
No Schooling Completed
No Schooling Completed Comparison
Indonesians
Immigrants from Dominica
3.2%
NO SCHOOLING COMPLETED
0.0/ 100
METRIC RATING
326th/ 347
METRIC RANK
2.8%
NO SCHOOLING COMPLETED
0.0/ 100
METRIC RATING
298th/ 347
METRIC RANK
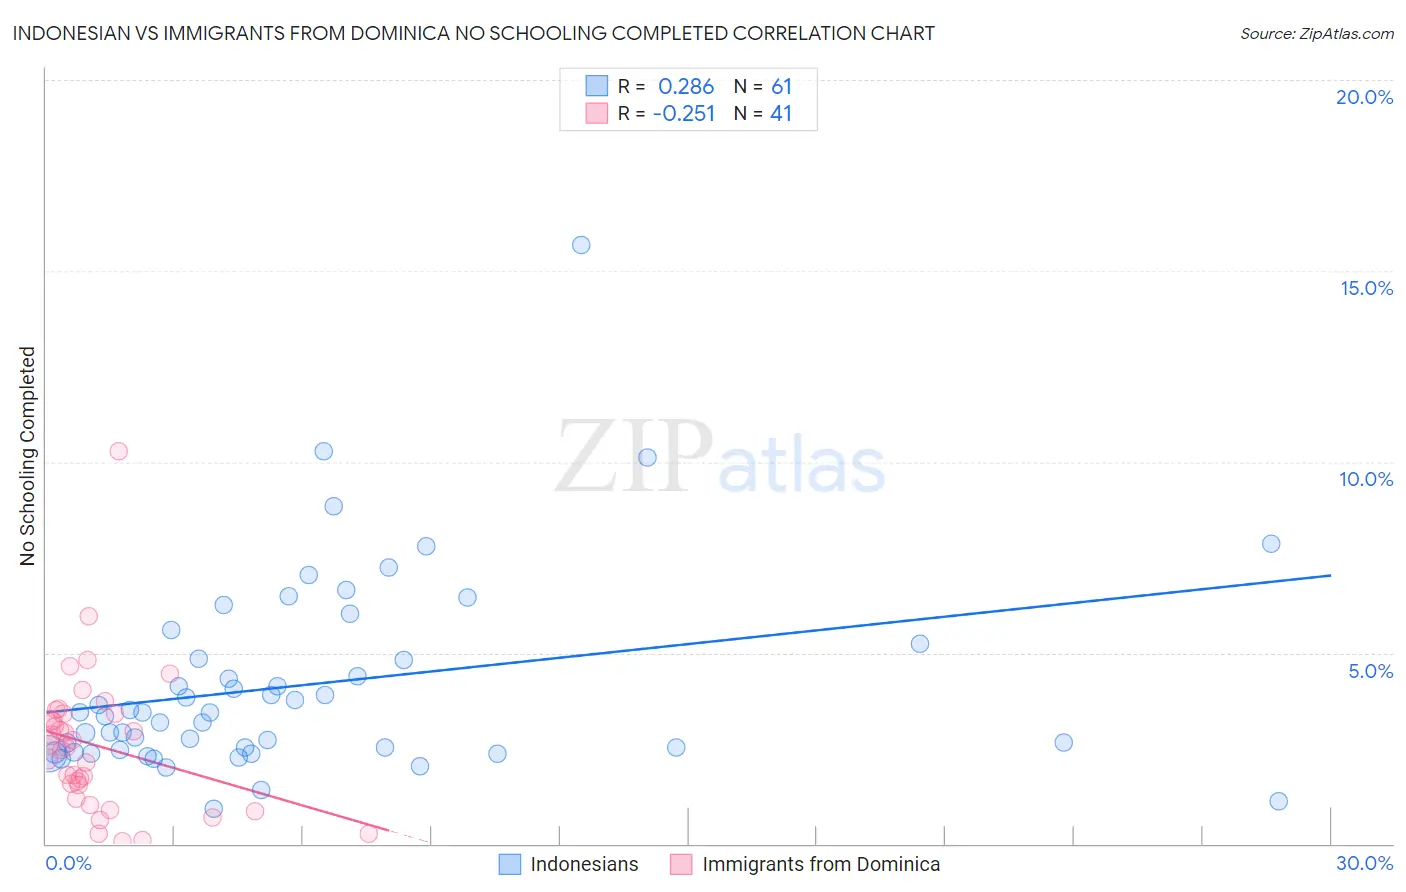
Indonesian vs Immigrants from Dominica No Schooling Completed Correlation Chart
The statistical analysis conducted on geographies consisting of 162,153,140 people shows a weak positive correlation between the proportion of Indonesians and percentage of population with no schooling in the United States with a correlation coefficient (R) of 0.286 and weighted average of 3.2%. Similarly, the statistical analysis conducted on geographies consisting of 83,717,936 people shows a weak negative correlation between the proportion of Immigrants from Dominica and percentage of population with no schooling in the United States with a correlation coefficient (R) of -0.251 and weighted average of 2.8%, a difference of 13.4%.
No Schooling Completed Correlation Summary
| Measurement | Indonesian | Immigrants from Dominica |
| Minimum | 0.92% | 0.065% |
| Maximum | 15.7% | 10.3% |
| Range | 14.8% | 10.2% |
| Mean | 4.2% | 2.6% |
| Median | 3.4% | 2.5% |
| Interquartile 25% (IQ1) | 2.4% | 1.4% |
| Interquartile 75% (IQ3) | 5.0% | 3.4% |
| Interquartile Range (IQR) | 2.6% | 2.0% |
| Standard Deviation (Sample) | 2.6% | 1.9% |
| Standard Deviation (Population) | 2.6% | 1.8% |
Similar Demographics by No Schooling Completed
Demographics Similar to Indonesians by No Schooling Completed
In terms of no schooling completed, the demographic groups most similar to Indonesians are Dominican (3.2%, a difference of 0.030%), Mexican American Indian (3.2%, a difference of 0.70%), Vietnamese (3.2%, a difference of 1.1%), Immigrants from Honduras (3.2%, a difference of 1.2%), and Immigrants from Laos (3.1%, a difference of 1.9%).
| Demographics | Rating | Rank | No Schooling Completed |
| Immigrants | Burma/Myanmar | 0.0 /100 | #319 | Tragic 3.1% |
| Immigrants | Bangladesh | 0.0 /100 | #320 | Tragic 3.1% |
| Immigrants | Laos | 0.0 /100 | #321 | Tragic 3.1% |
| Immigrants | Honduras | 0.0 /100 | #322 | Tragic 3.2% |
| Vietnamese | 0.0 /100 | #323 | Tragic 3.2% |
| Mexican American Indians | 0.0 /100 | #324 | Tragic 3.2% |
| Dominicans | 0.0 /100 | #325 | Tragic 3.2% |
| Indonesians | 0.0 /100 | #326 | Tragic 3.2% |
| Immigrants | Latin America | 0.0 /100 | #327 | Tragic 3.3% |
| Mexicans | 0.0 /100 | #328 | Tragic 3.3% |
| Immigrants | Vietnam | 0.0 /100 | #329 | Tragic 3.3% |
| Immigrants | Armenia | 0.0 /100 | #330 | Tragic 3.3% |
| Japanese | 0.0 /100 | #331 | Tragic 3.3% |
| Central Americans | 0.0 /100 | #332 | Tragic 3.4% |
| Immigrants | Dominican Republic | 0.0 /100 | #333 | Tragic 3.4% |
Demographics Similar to Immigrants from Dominica by No Schooling Completed
In terms of no schooling completed, the demographic groups most similar to Immigrants from Dominica are Immigrants from Cuba (2.8%, a difference of 0.33%), Central American Indian (2.8%, a difference of 0.51%), Haitian (2.9%, a difference of 0.83%), Immigrants (2.8%, a difference of 1.5%), and Houma (2.8%, a difference of 1.6%).
| Demographics | Rating | Rank | No Schooling Completed |
| British West Indians | 0.0 /100 | #291 | Tragic 2.7% |
| Immigrants | Grenada | 0.0 /100 | #292 | Tragic 2.8% |
| Malaysians | 0.0 /100 | #293 | Tragic 2.8% |
| Immigrants | Eritrea | 0.0 /100 | #294 | Tragic 2.8% |
| Houma | 0.0 /100 | #295 | Tragic 2.8% |
| Immigrants | Immigrants | 0.0 /100 | #296 | Tragic 2.8% |
| Immigrants | Cuba | 0.0 /100 | #297 | Tragic 2.8% |
| Immigrants | Dominica | 0.0 /100 | #298 | Tragic 2.8% |
| Central American Indians | 0.0 /100 | #299 | Tragic 2.8% |
| Haitians | 0.0 /100 | #300 | Tragic 2.9% |
| Immigrants | South Eastern Asia | 0.0 /100 | #301 | Tragic 2.9% |
| Immigrants | Caribbean | 0.0 /100 | #302 | Tragic 2.9% |
| Somalis | 0.0 /100 | #303 | Tragic 2.9% |
| Nicaraguans | 0.0 /100 | #304 | Tragic 2.9% |
| Ecuadorians | 0.0 /100 | #305 | Tragic 3.0% |