Immigrants from Zimbabwe vs Immigrants from Grenada No Schooling Completed
COMPARE
Immigrants from Zimbabwe
Immigrants from Grenada
No Schooling Completed
No Schooling Completed Comparison
Immigrants from Zimbabwe
Immigrants from Grenada
1.9%
NO SCHOOLING COMPLETED
96.2/ 100
METRIC RATING
113th/ 347
METRIC RANK
2.8%
NO SCHOOLING COMPLETED
0.0/ 100
METRIC RATING
292nd/ 347
METRIC RANK
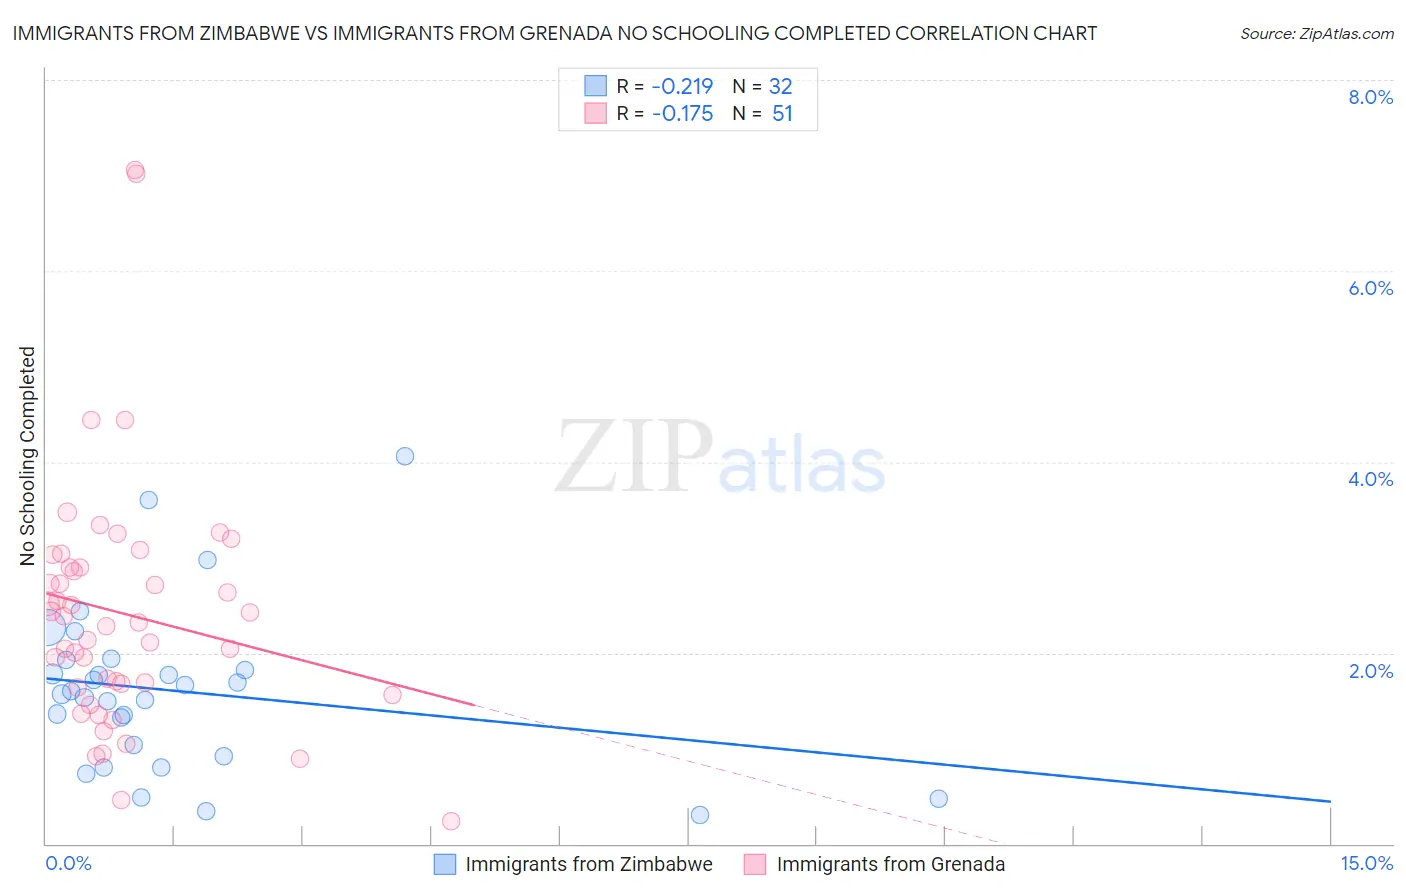
Immigrants from Zimbabwe vs Immigrants from Grenada No Schooling Completed Correlation Chart
The statistical analysis conducted on geographies consisting of 117,317,666 people shows a weak negative correlation between the proportion of Immigrants from Zimbabwe and percentage of population with no schooling in the United States with a correlation coefficient (R) of -0.219 and weighted average of 1.9%. Similarly, the statistical analysis conducted on geographies consisting of 67,145,019 people shows a poor negative correlation between the proportion of Immigrants from Grenada and percentage of population with no schooling in the United States with a correlation coefficient (R) of -0.175 and weighted average of 2.8%, a difference of 47.8%.
No Schooling Completed Correlation Summary
| Measurement | Immigrants from Zimbabwe | Immigrants from Grenada |
| Minimum | 0.31% | 0.24% |
| Maximum | 4.1% | 7.1% |
| Range | 3.8% | 6.8% |
| Mean | 1.6% | 2.4% |
| Median | 1.6% | 2.3% |
| Interquartile 25% (IQ1) | 0.97% | 1.6% |
| Interquartile 75% (IQ3) | 1.9% | 2.9% |
| Interquartile Range (IQR) | 0.90% | 1.3% |
| Standard Deviation (Sample) | 0.86% | 1.3% |
| Standard Deviation (Population) | 0.84% | 1.3% |
Similar Demographics by No Schooling Completed
Demographics Similar to Immigrants from Zimbabwe by No Schooling Completed
In terms of no schooling completed, the demographic groups most similar to Immigrants from Zimbabwe are Immigrants from Norway (1.9%, a difference of 0.010%), Syrian (1.9%, a difference of 0.14%), Lebanese (1.9%, a difference of 0.16%), Pueblo (1.9%, a difference of 0.25%), and Immigrants from Serbia (1.9%, a difference of 0.36%).
| Demographics | Rating | Rank | No Schooling Completed |
| Immigrants | France | 97.3 /100 | #106 | Exceptional 1.8% |
| Yugoslavians | 97.2 /100 | #107 | Exceptional 1.8% |
| Okinawans | 97.1 /100 | #108 | Exceptional 1.8% |
| Immigrants | Saudi Arabia | 96.8 /100 | #109 | Exceptional 1.9% |
| Immigrants | Latvia | 96.7 /100 | #110 | Exceptional 1.9% |
| Immigrants | Japan | 96.6 /100 | #111 | Exceptional 1.9% |
| Pueblo | 96.4 /100 | #112 | Exceptional 1.9% |
| Immigrants | Zimbabwe | 96.2 /100 | #113 | Exceptional 1.9% |
| Immigrants | Norway | 96.1 /100 | #114 | Exceptional 1.9% |
| Syrians | 96.0 /100 | #115 | Exceptional 1.9% |
| Lebanese | 96.0 /100 | #116 | Exceptional 1.9% |
| Immigrants | Serbia | 95.8 /100 | #117 | Exceptional 1.9% |
| Spanish | 95.5 /100 | #118 | Exceptional 1.9% |
| Iroquois | 95.1 /100 | #119 | Exceptional 1.9% |
| Immigrants | Bulgaria | 94.6 /100 | #120 | Exceptional 1.9% |
Demographics Similar to Immigrants from Grenada by No Schooling Completed
In terms of no schooling completed, the demographic groups most similar to Immigrants from Grenada are Malaysian (2.8%, a difference of 0.41%), Immigrants from Eritrea (2.8%, a difference of 0.58%), British West Indian (2.7%, a difference of 1.1%), Houma (2.8%, a difference of 1.1%), and Immigrants (2.8%, a difference of 1.2%).
| Demographics | Rating | Rank | No Schooling Completed |
| Immigrants | Barbados | 0.0 /100 | #285 | Tragic 2.7% |
| Immigrants | Portugal | 0.0 /100 | #286 | Tragic 2.7% |
| Immigrants | Afghanistan | 0.0 /100 | #287 | Tragic 2.7% |
| Immigrants | St. Vincent and the Grenadines | 0.0 /100 | #288 | Tragic 2.7% |
| Immigrants | Thailand | 0.0 /100 | #289 | Tragic 2.7% |
| Immigrants | Hong Kong | 0.0 /100 | #290 | Tragic 2.7% |
| British West Indians | 0.0 /100 | #291 | Tragic 2.7% |
| Immigrants | Grenada | 0.0 /100 | #292 | Tragic 2.8% |
| Malaysians | 0.0 /100 | #293 | Tragic 2.8% |
| Immigrants | Eritrea | 0.0 /100 | #294 | Tragic 2.8% |
| Houma | 0.0 /100 | #295 | Tragic 2.8% |
| Immigrants | Immigrants | 0.0 /100 | #296 | Tragic 2.8% |
| Immigrants | Cuba | 0.0 /100 | #297 | Tragic 2.8% |
| Immigrants | Dominica | 0.0 /100 | #298 | Tragic 2.8% |
| Central American Indians | 0.0 /100 | #299 | Tragic 2.8% |