Immigrants from Zimbabwe vs Apache Master's Degree

COMPARE

Immigrants from Zimbabwe
Race
Ancestry
AfghanAfricanAlaska NativeAlaskan AthabascanAlbanianAleutAlsatianAmericanArabArapahoArgentineanArmenianAssyrian/Chaldean/SyriacAustralianAustrianBahamianBangladeshiBarbadianBasqueBelgianBelizeanBermudanBhutaneseBlackfeetBolivianBrazilianBritishBritish West IndianBulgarianBurmeseCajunCambodianCanadianCape VerdeanCarpatho RusynCelticCentral AmericanCentral American IndianCherokeeCheyenneChickasawChileanChineseChippewaChoctawColombianColvilleComancheCosta RicanCreeCreekCroatianCrowCubanCypriotCzechCzechoslovakianDanishDelawareDominicanDutchDutch West IndianEastern EuropeanEcuadorianEgyptianEnglishEstonianEthiopianEuropeanFijianFilipinoFinnishFrenchFrench American IndianFrench CanadianGermanGerman RussianGhanaianGreekGuamanian/ChamorroGuatemalanGuyaneseHaitianHmongHonduranHopiHoumaHungarianIcelanderIndian (Asian)IndonesianInupiatIranianIraqiIrishIroquoisIsraeliItalianJamaicanJapaneseJordanianKenyanKiowaKoreanLaotianLatvianLebaneseLiberianLithuanianLumbeeLuxembourgerMacedonianMalaysianMalteseMarshalleseMenomineeMexicanMexican American IndianMongolianMoroccanNative HawaiianNavajoNepaleseNew ZealanderNicaraguanNigerianNorthern EuropeanNorwegianOkinawanOsageOttawaPaiutePakistaniPalestinianPanamanianParaguayanPennsylvania GermanPeruvianPimaPolishPortuguesePotawatomiPuebloPuerto RicanPuget Sound SalishRomanianRussianSalvadoranSamoanScandinavianScotch-IrishScottishSeminoleSenegaleseSerbianShoshoneSierra LeoneanSiouxSlavicSlovakSloveneSomaliSouth AfricanSouth AmericanSouth American IndianSoviet UnionSpaniardSpanishSpanish AmericanSpanish American IndianSri LankanSubsaharan AfricanSudaneseSwedishSwissSyrianTaiwaneseThaiTlingit-HaidaTohono O'OdhamTonganTrinidadian and TobagonianTsimshianTurkishU.S. Virgin IslanderUgandanUkrainianUruguayanUteVenezuelanVietnameseWelshWest IndianYakamaYaquiYugoslavianYumanYup'ikZimbabwean
Immigration
NonimmigrantsImmigrantsAfghanistanAfricaAlbaniaArgentinaArmeniaAsiaAustraliaAustriaBahamasBangladeshBarbadosBelarusBelgiumBelizeBoliviaBosnia and HerzegovinaBrazilBulgariaBurma/MyanmarCabo VerdeCambodiaCameroonCanadaCaribbeanCentral AmericaChileChinaColombiaCongoCosta RicaCroatiaCubaCzechoslovakiaDenmarkDominicaDominican RepublicEastern AfricaEastern AsiaEastern EuropeEcuadorEgyptEl SalvadorEnglandEritreaEthiopiaEuropeFijiFranceGermanyGhanaGreeceGrenadaGuatemalaGuyanaHaitiHondurasHong KongHungaryIndiaIndonesiaIranIraqIrelandIsraelItalyJamaicaJapanJordanKazakhstanKenyaKoreaKuwaitLaosLatin AmericaLatviaLebanonLiberiaLithuaniaMalaysiaMexicoMicronesiaMiddle AfricaMoldovaMoroccoNepalNetherlandsNicaraguaNigeriaNorth AmericaNorth MacedoniaNorthern AfricaNorthern EuropeNorwayOceaniaPakistanPanamaPeruPhilippinesPolandPortugalRomaniaRussiaSaudi ArabiaScotlandSenegalSerbiaSierra LeoneSingaporeSomaliaSouth AfricaSouth AmericaSouth Central AsiaSouth Eastern AsiaSouthern EuropeSpainSri LankaSt. Vincent and the GrenadinesSudanSwedenSwitzerlandSyriaTaiwanThailandTrinidad and TobagoTurkeyUgandaUkraineUruguayUzbekistanVenezuelaVietnamWest IndiesWestern AfricaWestern AsiaWestern EuropeYemenZaireZimbabweAzores
Apache
Race
Ancestry
AfghanAfricanAlaska NativeAlaskan AthabascanAlbanianAleutAlsatianAmericanApacheArabArapahoArgentineanArmenianAssyrian/Chaldean/SyriacAustralianAustrianBahamianBangladeshiBarbadianBasqueBelgianBelizeanBermudanBhutaneseBlackfeetBolivianBrazilianBritishBritish West IndianBulgarianBurmeseCajunCambodianCanadianCape VerdeanCarpatho RusynCelticCentral AmericanCentral American IndianCherokeeCheyenneChickasawChileanChineseChippewaChoctawColombianColvilleComancheCosta RicanCreeCreekCroatianCrowCubanCypriotCzechCzechoslovakianDanishDelawareDominicanDutchDutch West IndianEastern EuropeanEcuadorianEgyptianEnglishEstonianEthiopianEuropeanFijianFilipinoFinnishFrenchFrench American IndianFrench CanadianGermanGerman RussianGhanaianGreekGuamanian/ChamorroGuatemalanGuyaneseHaitianHmongHonduranHopiHoumaHungarianIcelanderIndian (Asian)IndonesianInupiatIranianIraqiIrishIroquoisIsraeliItalianJamaicanJapaneseJordanianKenyanKiowaKoreanLaotianLatvianLebaneseLiberianLithuanianLumbeeLuxembourgerMacedonianMalaysianMalteseMarshalleseMenomineeMexicanMexican American IndianMongolianMoroccanNative HawaiianNavajoNepaleseNew ZealanderNicaraguanNigerianNorthern EuropeanNorwegianOkinawanOsageOttawaPaiutePakistaniPalestinianPanamanianParaguayanPennsylvania GermanPeruvianPimaPolishPortuguesePotawatomiPuebloPuerto RicanPuget Sound SalishRomanianRussianSalvadoranSamoanScandinavianScotch-IrishScottishSeminoleSenegaleseSerbianShoshoneSierra LeoneanSiouxSlavicSlovakSloveneSomaliSouth AfricanSouth AmericanSouth American IndianSoviet UnionSpaniardSpanishSpanish AmericanSpanish American IndianSri LankanSubsaharan AfricanSudaneseSwedishSwissSyrianTaiwaneseThaiTlingit-HaidaTohono O'OdhamTonganTrinidadian and TobagonianTsimshianTurkishU.S. Virgin IslanderUgandanUkrainianUruguayanUteVenezuelanVietnameseWelshWest IndianYakamaYaquiYugoslavianYumanYup'ikZimbabwean
Immigration
NonimmigrantsImmigrantsAfghanistanAfricaAlbaniaArgentinaArmeniaAsiaAustraliaAustriaBahamasBangladeshBarbadosBelarusBelgiumBelizeBoliviaBosnia and HerzegovinaBrazilBulgariaBurma/MyanmarCabo VerdeCambodiaCameroonCanadaCaribbeanCentral AmericaChileChinaColombiaCongoCosta RicaCroatiaCubaCzechoslovakiaDenmarkDominicaDominican RepublicEastern AfricaEastern AsiaEastern EuropeEcuadorEgyptEl SalvadorEnglandEritreaEthiopiaEuropeFijiFranceGermanyGhanaGreeceGrenadaGuatemalaGuyanaHaitiHondurasHong KongHungaryIndiaIndonesiaIranIraqIrelandIsraelItalyJamaicaJapanJordanKazakhstanKenyaKoreaKuwaitLaosLatin AmericaLatviaLebanonLiberiaLithuaniaMalaysiaMexicoMicronesiaMiddle AfricaMoldovaMoroccoNepalNetherlandsNicaraguaNigeriaNorth AmericaNorth MacedoniaNorthern AfricaNorthern EuropeNorwayOceaniaPakistanPanamaPeruPhilippinesPolandPortugalRomaniaRussiaSaudi ArabiaScotlandSenegalSerbiaSierra LeoneSingaporeSomaliaSouth AfricaSouth AmericaSouth Central AsiaSouth Eastern AsiaSouthern EuropeSpainSri LankaSt. Vincent and the GrenadinesSudanSwedenSwitzerlandSyriaTaiwanThailandTrinidad and TobagoTurkeyUgandaUkraineUruguayUzbekistanVenezuelaVietnamWest IndiesWestern AfricaWestern AsiaWestern EuropeYemenZaireAzores
Master's Degree
Income
Poverty
Unemployment
Labor Participation
Family Structure
Vehicle Availability
Education Level
Disability

Master's Degree Comparison

Immigrants from Zimbabwe

Apache

Exceptional
Tragic
17.4%
MASTER'S DEGREE
99.5/ 100
METRIC RATING
83rd/ 347
METRIC RANK
11.0%
MASTER'S DEGREE
0.0/ 100
METRIC RATING
315th/ 347
METRIC RANK

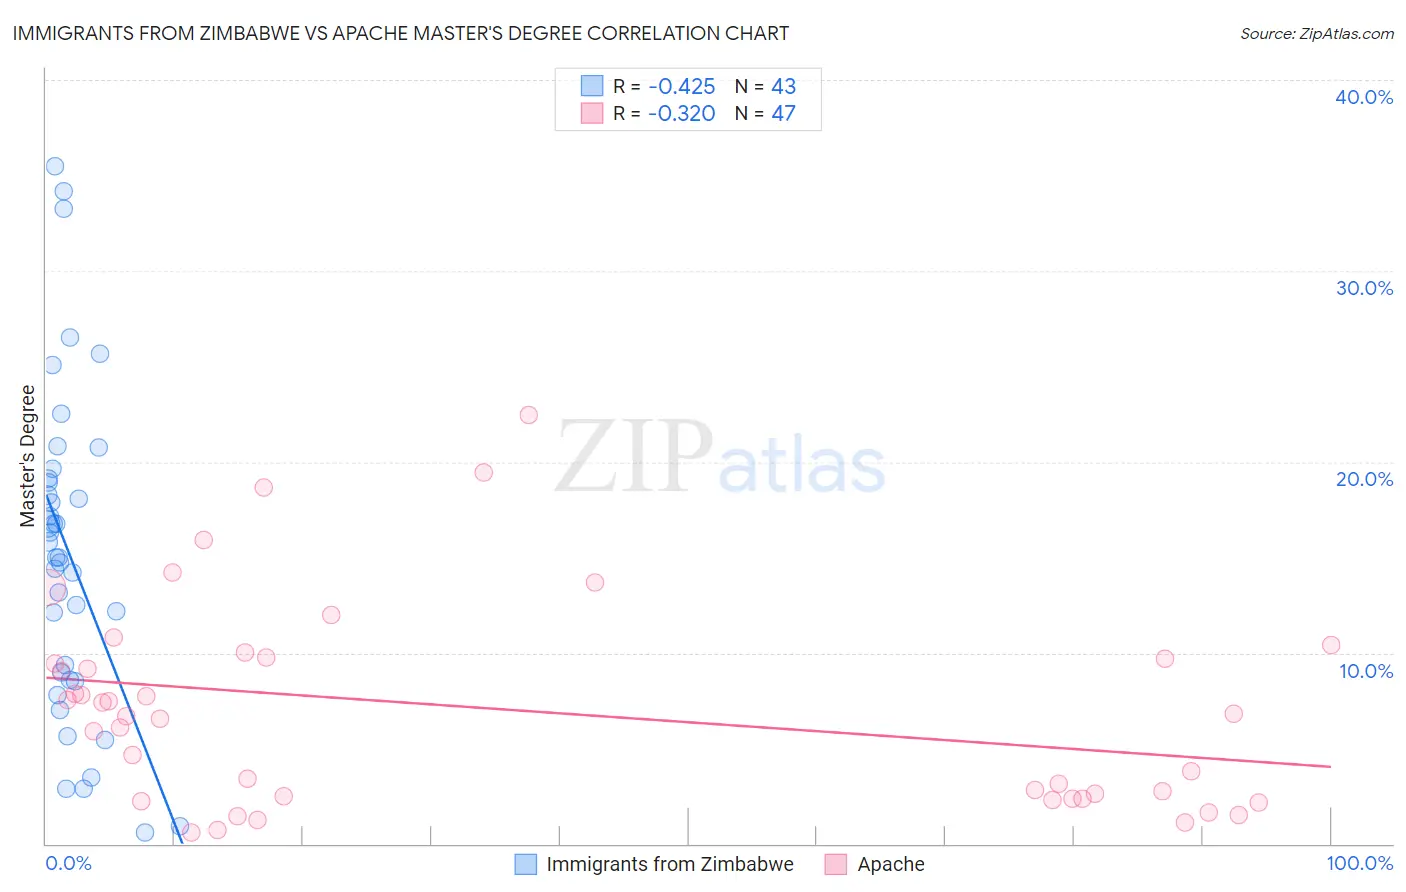
Immigrants from Zimbabwe vs Apache Master's Degree Correlation Chart

The statistical analysis conducted on geographies consisting of 117,807,833 people shows a moderate negative correlation between the proportion of Immigrants from Zimbabwe and percentage of population with at least master's degree education in the United States with a correlation coefficient (R) of -0.425 and weighted average of 17.4%. Similarly, the statistical analysis conducted on geographies consisting of 231,057,413 people shows a mild negative correlation between the proportion of Apache and percentage of population with at least master's degree education in the United States with a correlation coefficient (R) of -0.320 and weighted average of 11.0%, a difference of 59.0%.
Immigrants from Zimbabwe vs Apache Master's Degree

Master's Degree Correlation Summary

MeasurementImmigrants from ZimbabweApache
Minimum0.61%0.59%
Maximum35.5%22.5%
Range34.9%21.9%
Mean15.1%7.0%
Median15.0%6.7%
Interquartile 25% (IQ1)8.6%2.3%
Interquartile 75% (IQ3)19.1%9.8%
Interquartile Range (IQR)10.5%7.4%
Standard Deviation (Sample)8.4%5.3%
Standard Deviation (Population)8.3%5.3%

Similar Demographics by Master's Degree

Demographics Similar to Immigrants from Zimbabwe by Master's Degree

In terms of master's degree, the demographic groups most similar to Immigrants from Zimbabwe are Greek (17.5%, a difference of 0.050%), Immigrants from Western Asia (17.5%, a difference of 0.11%), Immigrants from Scotland (17.4%, a difference of 0.33%), Carpatho Rusyn (17.5%, a difference of 0.40%), and Immigrants from Lebanon (17.5%, a difference of 0.46%).
DemographicsRating | RankMaster's Degree
Immigrants | Indonesia
99.6
/100
|
#76
Exceptional
17.6%
Immigrants | Eastern Europe
99.6
/100
|
#77
Exceptional
17.6%
Immigrants | Hungary
99.6
/100
|
#78
Exceptional
17.5%
Immigrants | Lebanon
99.6
/100
|
#79
Exceptional
17.5%
Carpatho Rusyns
99.6
/100
|
#80
Exceptional
17.5%
Immigrants | Western Asia
99.5
/100
|
#81
Exceptional
17.5%
Greeks
99.5
/100
|
#82
Exceptional
17.5%
Immigrants | Zimbabwe
99.5
/100
|
#83
Exceptional
17.4%
Immigrants | Scotland
99.4
/100
|
#84
Exceptional
17.4%
Immigrants | Brazil
99.4
/100
|
#85
Exceptional
17.4%
Immigrants | Croatia
99.3
/100
|
#86
Exceptional
17.3%
Maltese
99.3
/100
|
#87
Exceptional
17.3%
Immigrants | Canada
99.2
/100
|
#88
Exceptional
17.2%
Bhutanese
99.1
/100
|
#89
Exceptional
17.2%
Immigrants | Egypt
99.1
/100
|
#90
Exceptional
17.2%

Demographics Similar to Apache by Master's Degree

In terms of master's degree, the demographic groups most similar to Apache are Cajun (11.0%, a difference of 0.0%), Hispanic or Latino (10.9%, a difference of 0.34%), Yaqui (11.0%, a difference of 0.40%), Choctaw (11.0%, a difference of 0.58%), and Seminole (11.0%, a difference of 0.67%).
DemographicsRating | RankMaster's Degree
Puerto Ricans
0.0
/100
|
#308
Tragic
11.2%
Puget Sound Salish
0.0
/100
|
#309
Tragic
11.1%
Shoshone
0.0
/100
|
#310
Tragic
11.1%
Seminole
0.0
/100
|
#311
Tragic
11.0%
Choctaw
0.0
/100
|
#312
Tragic
11.0%
Yaqui
0.0
/100
|
#313
Tragic
11.0%
Cajuns
0.0
/100
|
#314
Tragic
11.0%
Apache
0.0
/100
|
#315
Tragic
11.0%
Hispanics or Latinos
0.0
/100
|
#316
Tragic
10.9%
Hopi
0.0
/100
|
#317
Tragic
10.9%
Immigrants | Cuba
0.0
/100
|
#318
Tragic
10.9%
Kiowa
0.0
/100
|
#319
Tragic
10.8%
Immigrants | Micronesia
0.0
/100
|
#320
Tragic
10.8%
Pennsylvania Germans
0.0
/100
|
#321
Tragic
10.7%
Sioux
0.0
/100
|
#322
Tragic
10.7%