Immigrants from Venezuela vs Czechoslovakian 3rd Grade

COMPARE

Immigrants from Venezuela
Race
Ancestry
AfghanAfricanAlaska NativeAlaskan AthabascanAlbanianAleutAlsatianAmericanApacheArabArapahoArgentineanArmenianAssyrian/Chaldean/SyriacAustralianAustrianBahamianBangladeshiBarbadianBasqueBelgianBelizeanBermudanBhutaneseBlackfeetBolivianBrazilianBritishBritish West IndianBulgarianBurmeseCajunCambodianCanadianCape VerdeanCarpatho RusynCelticCentral AmericanCentral American IndianCherokeeCheyenneChickasawChileanChineseChippewaChoctawColombianColvilleComancheCosta RicanCreeCreekCroatianCrowCubanCypriotCzechDanishDelawareDominicanDutchDutch West IndianEastern EuropeanEcuadorianEgyptianEnglishEstonianEthiopianEuropeanFijianFilipinoFinnishFrenchFrench American IndianFrench CanadianGermanGerman RussianGhanaianGreekGuamanian/ChamorroGuatemalanGuyaneseHaitianHmongHonduranHopiHoumaHungarianIcelanderIndian (Asian)IndonesianInupiatIranianIraqiIrishIroquoisIsraeliItalianJamaicanJapaneseJordanianKenyanKiowaKoreanLaotianLatvianLebaneseLiberianLithuanianLumbeeLuxembourgerMacedonianMalaysianMalteseMarshalleseMenomineeMexicanMexican American IndianMongolianMoroccanNative HawaiianNavajoNepaleseNew ZealanderNicaraguanNigerianNorthern EuropeanNorwegianOkinawanOsageOttawaPaiutePakistaniPalestinianPanamanianParaguayanPennsylvania GermanPeruvianPimaPolishPortuguesePotawatomiPuebloPuerto RicanPuget Sound SalishRomanianRussianSalvadoranSamoanScandinavianScotch-IrishScottishSeminoleSenegaleseSerbianShoshoneSierra LeoneanSiouxSlavicSlovakSloveneSomaliSouth AfricanSouth AmericanSouth American IndianSoviet UnionSpaniardSpanishSpanish AmericanSpanish American IndianSri LankanSubsaharan AfricanSudaneseSwedishSwissSyrianTaiwaneseThaiTlingit-HaidaTohono O'OdhamTonganTrinidadian and TobagonianTsimshianTurkishU.S. Virgin IslanderUgandanUkrainianUruguayanUteVenezuelanVietnameseWelshWest IndianYakamaYaquiYugoslavianYumanYup'ikZimbabwean
Immigration
NonimmigrantsImmigrantsAfghanistanAfricaAlbaniaArgentinaArmeniaAsiaAustraliaAustriaBahamasBangladeshBarbadosBelarusBelgiumBelizeBoliviaBosnia and HerzegovinaBrazilBulgariaBurma/MyanmarCabo VerdeCambodiaCameroonCanadaCaribbeanCentral AmericaChileChinaColombiaCongoCosta RicaCroatiaCubaCzechoslovakiaDenmarkDominicaDominican RepublicEastern AfricaEastern AsiaEastern EuropeEcuadorEgyptEl SalvadorEnglandEritreaEthiopiaEuropeFijiFranceGermanyGhanaGreeceGrenadaGuatemalaGuyanaHaitiHondurasHong KongHungaryIndiaIndonesiaIranIraqIrelandIsraelItalyJamaicaJapanJordanKazakhstanKenyaKoreaKuwaitLaosLatin AmericaLatviaLebanonLiberiaLithuaniaMalaysiaMexicoMicronesiaMiddle AfricaMoldovaMoroccoNepalNetherlandsNicaraguaNigeriaNorth AmericaNorth MacedoniaNorthern AfricaNorthern EuropeNorwayOceaniaPakistanPanamaPeruPhilippinesPolandPortugalRomaniaRussiaSaudi ArabiaScotlandSenegalSerbiaSierra LeoneSingaporeSomaliaSouth AfricaSouth AmericaSouth Central AsiaSouth Eastern AsiaSouthern EuropeSpainSri LankaSt. Vincent and the GrenadinesSudanSwedenSwitzerlandSyriaTaiwanThailandTrinidad and TobagoTurkeyUgandaUkraineUruguayUzbekistanVenezuelaVietnamWest IndiesWestern AfricaWestern AsiaWestern EuropeYemenZaireZimbabweAzores
Czechoslovakian
Race
Ancestry
AfghanAfricanAlaska NativeAlaskan AthabascanAlbanianAleutAlsatianAmericanApacheArabArapahoArgentineanArmenianAssyrian/Chaldean/SyriacAustralianAustrianBahamianBangladeshiBarbadianBasqueBelgianBelizeanBermudanBhutaneseBlackfeetBolivianBrazilianBritishBritish West IndianBulgarianBurmeseCajunCambodianCanadianCape VerdeanCarpatho RusynCelticCentral AmericanCentral American IndianCherokeeCheyenneChickasawChileanChineseChippewaChoctawColombianColvilleComancheCosta RicanCreeCreekCroatianCrowCubanCypriotCzechCzechoslovakianDanishDelawareDominicanDutchDutch West IndianEastern EuropeanEcuadorianEgyptianEnglishEstonianEthiopianEuropeanFijianFilipinoFinnishFrenchFrench American IndianFrench CanadianGermanGerman RussianGhanaianGreekGuamanian/ChamorroGuatemalanGuyaneseHaitianHmongHonduranHopiHoumaHungarianIcelanderIndian (Asian)IndonesianInupiatIranianIraqiIrishIroquoisIsraeliItalianJamaicanJapaneseJordanianKenyanKiowaKoreanLaotianLatvianLebaneseLiberianLithuanianLumbeeLuxembourgerMacedonianMalaysianMalteseMarshalleseMenomineeMexicanMexican American IndianMongolianMoroccanNative HawaiianNavajoNepaleseNew ZealanderNicaraguanNigerianNorthern EuropeanNorwegianOkinawanOsageOttawaPaiutePakistaniPalestinianPanamanianParaguayanPennsylvania GermanPeruvianPimaPolishPortuguesePotawatomiPuebloPuerto RicanPuget Sound SalishRomanianRussianSalvadoranSamoanScandinavianScotch-IrishScottishSeminoleSenegaleseSerbianShoshoneSierra LeoneanSiouxSlavicSlovakSloveneSomaliSouth AfricanSouth AmericanSouth American IndianSoviet UnionSpaniardSpanishSpanish AmericanSpanish American IndianSri LankanSubsaharan AfricanSudaneseSwedishSwissSyrianTaiwaneseThaiTlingit-HaidaTohono O'OdhamTonganTrinidadian and TobagonianTsimshianTurkishU.S. Virgin IslanderUgandanUkrainianUruguayanUteVenezuelanVietnameseWelshWest IndianYakamaYaquiYugoslavianYumanYup'ikZimbabwean
Immigration
NonimmigrantsImmigrantsAfghanistanAfricaAlbaniaArgentinaArmeniaAsiaAustraliaAustriaBahamasBangladeshBarbadosBelarusBelgiumBelizeBoliviaBosnia and HerzegovinaBrazilBulgariaBurma/MyanmarCabo VerdeCambodiaCameroonCanadaCaribbeanCentral AmericaChileChinaColombiaCongoCosta RicaCroatiaCubaCzechoslovakiaDenmarkDominicaDominican RepublicEastern AfricaEastern AsiaEastern EuropeEcuadorEgyptEl SalvadorEnglandEritreaEthiopiaEuropeFijiFranceGermanyGhanaGreeceGrenadaGuatemalaGuyanaHaitiHondurasHong KongHungaryIndiaIndonesiaIranIraqIrelandIsraelItalyJamaicaJapanJordanKazakhstanKenyaKoreaKuwaitLaosLatin AmericaLatviaLebanonLiberiaLithuaniaMalaysiaMexicoMicronesiaMiddle AfricaMoldovaMoroccoNepalNetherlandsNicaraguaNigeriaNorth AmericaNorth MacedoniaNorthern AfricaNorthern EuropeNorwayOceaniaPakistanPanamaPeruPhilippinesPolandPortugalRomaniaRussiaSaudi ArabiaScotlandSenegalSerbiaSierra LeoneSingaporeSomaliaSouth AfricaSouth AmericaSouth Central AsiaSouth Eastern AsiaSouthern EuropeSpainSri LankaSt. Vincent and the GrenadinesSudanSwedenSwitzerlandSyriaTaiwanThailandTrinidad and TobagoTurkeyUgandaUkraineUruguayUzbekistanVietnamWest IndiesWestern AfricaWestern AsiaWestern EuropeYemenZaireZimbabweAzores
3rd Grade
Income
Poverty
Unemployment
Labor Participation
Family Structure
Vehicle Availability
Education Level
Disability

3rd Grade Comparison

Immigrants from Venezuela

Czechoslovakians

Average
Exceptional
97.7%
3RD GRADE
44.4/ 100
METRIC RATING
181st/ 347
METRIC RANK
98.3%
3RD GRADE
99.8/ 100
METRIC RATING
47th/ 347
METRIC RANK

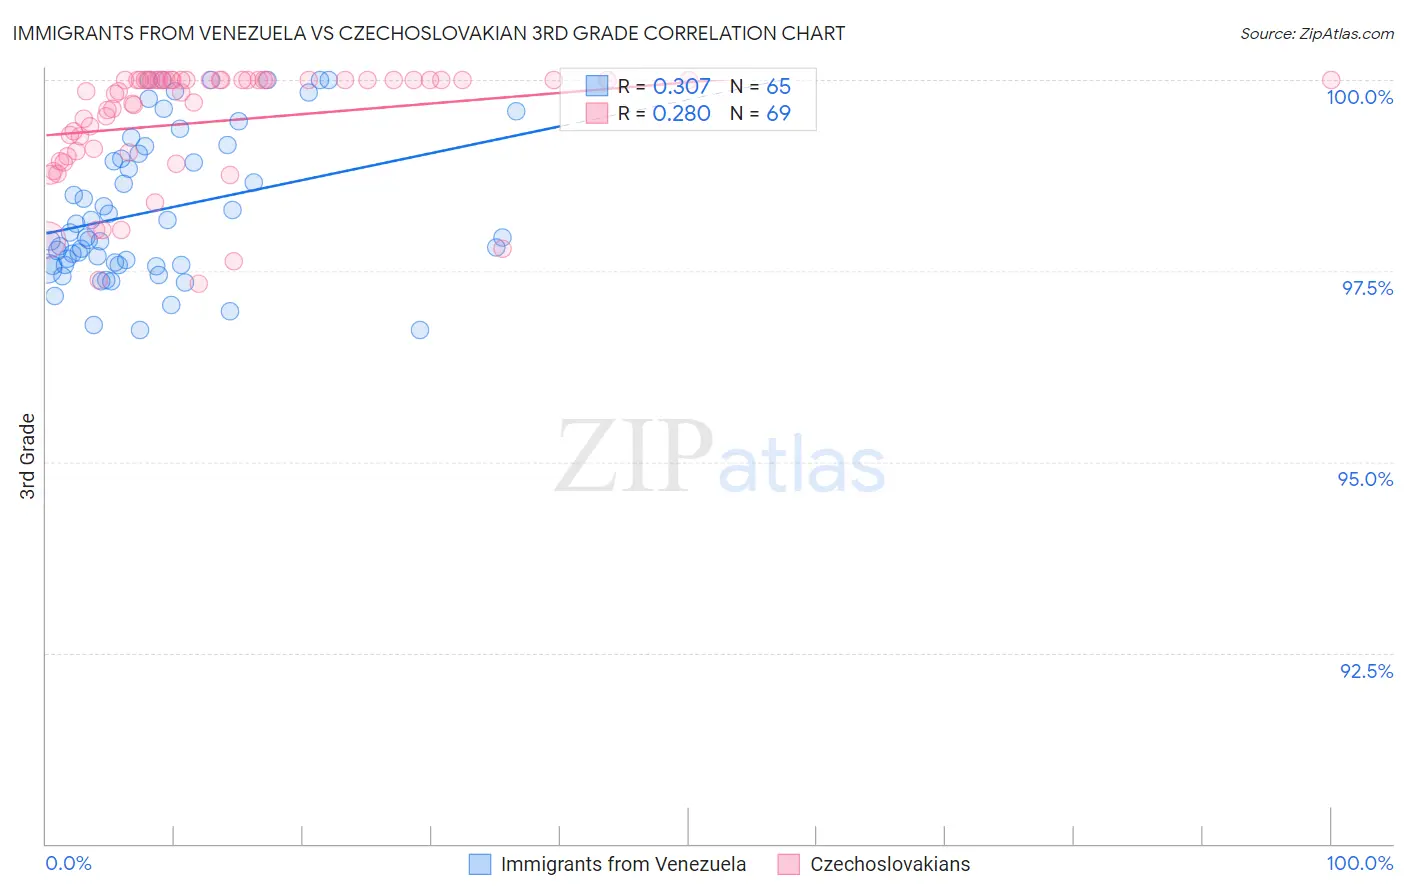
Immigrants from Venezuela vs Czechoslovakian 3rd Grade Correlation Chart

The statistical analysis conducted on geographies consisting of 287,866,009 people shows a mild positive correlation between the proportion of Immigrants from Venezuela and percentage of population with at least 3rd grade education in the United States with a correlation coefficient (R) of 0.307 and weighted average of 97.7%. Similarly, the statistical analysis conducted on geographies consisting of 368,668,876 people shows a weak positive correlation between the proportion of Czechoslovakians and percentage of population with at least 3rd grade education in the United States with a correlation coefficient (R) of 0.280 and weighted average of 98.3%, a difference of 0.56%.
Immigrants from Venezuela vs Czechoslovakian 3rd Grade

3rd Grade Correlation Summary

MeasurementImmigrants from VenezuelaCzechoslovakian
Minimum96.7%97.3%
Maximum100.0%100.0%
Range3.3%2.7%
Mean98.3%99.5%
Median97.9%99.9%
Interquartile 25% (IQ1)97.6%99.0%
Interquartile 75% (IQ3)99.1%100.0%
Interquartile Range (IQR)1.5%0.98%
Standard Deviation (Sample)0.96%0.76%
Standard Deviation (Population)0.95%0.75%

Similar Demographics by 3rd Grade

Demographics Similar to Immigrants from Venezuela by 3rd Grade

In terms of 3rd grade, the demographic groups most similar to Immigrants from Venezuela are Immigrants from Sri Lanka (97.7%, a difference of 0.0%), Immigrants from Micronesia (97.8%, a difference of 0.010%), Immigrants from Poland (97.8%, a difference of 0.010%), Egyptian (97.7%, a difference of 0.010%), and Immigrants from Brazil (97.7%, a difference of 0.010%).
DemographicsRating | Rank3rd Grade
Navajo
50.0
/100
|
#174
Average
97.8%
Immigrants | Micronesia
47.6
/100
|
#175
Average
97.8%
Immigrants | Poland
47.1
/100
|
#176
Average
97.8%
Egyptians
46.6
/100
|
#177
Average
97.7%
Immigrants | Brazil
46.4
/100
|
#178
Average
97.7%
Immigrants | Belarus
45.9
/100
|
#179
Average
97.7%
Immigrants | Sri Lanka
45.1
/100
|
#180
Average
97.7%
Immigrants | Venezuela
44.4
/100
|
#181
Average
97.7%
Argentineans
42.9
/100
|
#182
Average
97.7%
Arabs
40.0
/100
|
#183
Fair
97.7%
Immigrants | Kazakhstan
37.4
/100
|
#184
Fair
97.7%
Immigrants | Argentina
37.0
/100
|
#185
Fair
97.7%
Portuguese
36.2
/100
|
#186
Fair
97.7%
Natives/Alaskans
35.2
/100
|
#187
Fair
97.7%
Immigrants | Taiwan
34.2
/100
|
#188
Fair
97.7%

Demographics Similar to Czechoslovakians by 3rd Grade

In terms of 3rd grade, the demographic groups most similar to Czechoslovakians are Ottawa (98.3%, a difference of 0.0%), Lumbee (98.3%, a difference of 0.0%), Estonian (98.3%, a difference of 0.020%), Celtic (98.3%, a difference of 0.020%), and Australian (98.3%, a difference of 0.020%).
DemographicsRating | Rank3rd Grade
Eastern Europeans
99.9
/100
|
#40
Exceptional
98.3%
Luxembourgers
99.9
/100
|
#41
Exceptional
98.3%
Belgians
99.9
/100
|
#42
Exceptional
98.3%
Northern Europeans
99.9
/100
|
#43
Exceptional
98.3%
Hungarians
99.9
/100
|
#44
Exceptional
98.3%
Native Hawaiians
99.9
/100
|
#45
Exceptional
98.3%
Ottawa
99.8
/100
|
#46
Exceptional
98.3%
Czechoslovakians
99.8
/100
|
#47
Exceptional
98.3%
Lumbee
99.8
/100
|
#48
Exceptional
98.3%
Estonians
99.8
/100
|
#49
Exceptional
98.3%
Celtics
99.8
/100
|
#50
Exceptional
98.3%
Australians
99.8
/100
|
#51
Exceptional
98.3%
Whites/Caucasians
99.8
/100
|
#52
Exceptional
98.3%
Immigrants | Scotland
99.8
/100
|
#53
Exceptional
98.3%
Bulgarians
99.8
/100
|
#54
Exceptional
98.3%