Immigrants from Sweden vs Subsaharan African 1st Grade

COMPARE

Immigrants from Sweden
Race
Ancestry
AfghanAfricanAlaska NativeAlaskan AthabascanAlbanianAleutAlsatianAmericanApacheArabArapahoArgentineanArmenianAssyrian/Chaldean/SyriacAustralianAustrianBahamianBangladeshiBarbadianBasqueBelgianBelizeanBermudanBhutaneseBlackfeetBolivianBrazilianBritishBritish West IndianBulgarianBurmeseCajunCambodianCanadianCape VerdeanCarpatho RusynCelticCentral AmericanCentral American IndianCherokeeCheyenneChickasawChileanChineseChippewaChoctawColombianColvilleComancheCosta RicanCreeCreekCroatianCrowCubanCypriotCzechCzechoslovakianDanishDelawareDominicanDutchDutch West IndianEastern EuropeanEcuadorianEgyptianEnglishEstonianEthiopianEuropeanFijianFilipinoFinnishFrenchFrench American IndianFrench CanadianGermanGerman RussianGhanaianGreekGuamanian/ChamorroGuatemalanGuyaneseHaitianHmongHonduranHopiHoumaHungarianIcelanderIndian (Asian)IndonesianInupiatIranianIraqiIrishIroquoisIsraeliItalianJamaicanJapaneseJordanianKenyanKiowaKoreanLaotianLatvianLebaneseLiberianLithuanianLumbeeLuxembourgerMacedonianMalaysianMalteseMarshalleseMenomineeMexicanMexican American IndianMongolianMoroccanNative HawaiianNavajoNepaleseNew ZealanderNicaraguanNigerianNorthern EuropeanNorwegianOkinawanOsageOttawaPaiutePakistaniPalestinianPanamanianParaguayanPennsylvania GermanPeruvianPimaPolishPortuguesePotawatomiPuebloPuerto RicanPuget Sound SalishRomanianRussianSalvadoranSamoanScandinavianScotch-IrishScottishSeminoleSenegaleseSerbianShoshoneSierra LeoneanSiouxSlavicSlovakSloveneSomaliSouth AfricanSouth AmericanSouth American IndianSoviet UnionSpaniardSpanishSpanish AmericanSpanish American IndianSri LankanSudaneseSwedishSwissSyrianTaiwaneseThaiTlingit-HaidaTohono O'OdhamTonganTrinidadian and TobagonianTsimshianTurkishU.S. Virgin IslanderUgandanUkrainianUruguayanUteVenezuelanVietnameseWelshWest IndianYakamaYaquiYugoslavianYumanYup'ikZimbabwean
Immigration
NonimmigrantsImmigrantsAfghanistanAfricaAlbaniaArgentinaArmeniaAsiaAustraliaAustriaBahamasBangladeshBarbadosBelarusBelgiumBelizeBoliviaBosnia and HerzegovinaBrazilBulgariaBurma/MyanmarCabo VerdeCambodiaCameroonCanadaCaribbeanCentral AmericaChileChinaColombiaCongoCosta RicaCroatiaCubaCzechoslovakiaDenmarkDominicaDominican RepublicEastern AfricaEastern AsiaEastern EuropeEcuadorEgyptEl SalvadorEnglandEritreaEthiopiaEuropeFijiFranceGermanyGhanaGreeceGrenadaGuatemalaGuyanaHaitiHondurasHong KongHungaryIndiaIndonesiaIranIraqIrelandIsraelItalyJamaicaJapanJordanKazakhstanKenyaKoreaKuwaitLaosLatin AmericaLatviaLebanonLiberiaLithuaniaMalaysiaMexicoMicronesiaMiddle AfricaMoldovaMoroccoNepalNetherlandsNicaraguaNigeriaNorth AmericaNorth MacedoniaNorthern AfricaNorthern EuropeNorwayOceaniaPakistanPanamaPeruPhilippinesPolandPortugalRomaniaRussiaSaudi ArabiaScotlandSenegalSerbiaSierra LeoneSingaporeSomaliaSouth AfricaSouth AmericaSouth Central AsiaSouth Eastern AsiaSouthern EuropeSpainSri LankaSt. Vincent and the GrenadinesSudanSwedenSwitzerlandSyriaTaiwanThailandTrinidad and TobagoTurkeyUgandaUkraineUruguayUzbekistanVenezuelaVietnamWest IndiesWestern AfricaWestern AsiaWestern EuropeYemenZaireZimbabweAzores
Subsaharan African
Race
Ancestry
AfghanAfricanAlaska NativeAlaskan AthabascanAlbanianAleutAlsatianAmericanApacheArabArapahoArgentineanArmenianAssyrian/Chaldean/SyriacAustralianAustrianBahamianBangladeshiBarbadianBasqueBelgianBelizeanBermudanBhutaneseBlackfeetBolivianBrazilianBritishBritish West IndianBulgarianBurmeseCajunCambodianCanadianCape VerdeanCarpatho RusynCelticCentral AmericanCentral American IndianCherokeeCheyenneChickasawChileanChineseChippewaChoctawColombianColvilleComancheCosta RicanCreeCreekCroatianCrowCubanCypriotCzechCzechoslovakianDanishDelawareDominicanDutchDutch West IndianEastern EuropeanEcuadorianEgyptianEnglishEstonianEthiopianEuropeanFijianFilipinoFinnishFrenchFrench American IndianFrench CanadianGermanGerman RussianGhanaianGreekGuamanian/ChamorroGuatemalanGuyaneseHaitianHmongHonduranHopiHoumaHungarianIcelanderIndian (Asian)IndonesianInupiatIranianIraqiIrishIroquoisIsraeliItalianJamaicanJapaneseJordanianKenyanKiowaKoreanLaotianLatvianLebaneseLiberianLithuanianLumbeeLuxembourgerMacedonianMalaysianMalteseMarshalleseMenomineeMexicanMexican American IndianMongolianMoroccanNative HawaiianNavajoNepaleseNew ZealanderNicaraguanNigerianNorthern EuropeanNorwegianOkinawanOsageOttawaPaiutePakistaniPalestinianPanamanianParaguayanPennsylvania GermanPeruvianPimaPolishPortuguesePotawatomiPuebloPuerto RicanPuget Sound SalishRomanianRussianSalvadoranSamoanScandinavianScotch-IrishScottishSeminoleSenegaleseSerbianShoshoneSierra LeoneanSiouxSlavicSlovakSloveneSomaliSouth AfricanSouth AmericanSouth American IndianSoviet UnionSpaniardSpanishSpanish AmericanSpanish American IndianSri LankanSubsaharan AfricanSudaneseSwedishSwissSyrianTaiwaneseThaiTlingit-HaidaTohono O'OdhamTonganTrinidadian and TobagonianTsimshianTurkishU.S. Virgin IslanderUgandanUkrainianUruguayanUteVenezuelanVietnameseWelshWest IndianYakamaYaquiYugoslavianYumanYup'ikZimbabwean
Immigration
NonimmigrantsImmigrantsAfghanistanAfricaAlbaniaArgentinaArmeniaAsiaAustraliaAustriaBahamasBangladeshBarbadosBelarusBelgiumBelizeBoliviaBosnia and HerzegovinaBrazilBulgariaBurma/MyanmarCabo VerdeCambodiaCameroonCanadaCaribbeanCentral AmericaChileChinaColombiaCongoCosta RicaCroatiaCubaCzechoslovakiaDenmarkDominicaDominican RepublicEastern AfricaEastern AsiaEastern EuropeEcuadorEgyptEl SalvadorEnglandEritreaEthiopiaEuropeFijiFranceGermanyGhanaGreeceGrenadaGuatemalaGuyanaHaitiHondurasHong KongHungaryIndiaIndonesiaIranIraqIrelandIsraelItalyJamaicaJapanJordanKazakhstanKenyaKoreaKuwaitLaosLatin AmericaLatviaLebanonLiberiaLithuaniaMalaysiaMexicoMicronesiaMiddle AfricaMoldovaMoroccoNepalNetherlandsNicaraguaNigeriaNorth AmericaNorth MacedoniaNorthern AfricaNorthern EuropeNorwayOceaniaPakistanPanamaPeruPhilippinesPolandPortugalRomaniaRussiaSaudi ArabiaScotlandSenegalSerbiaSierra LeoneSingaporeSomaliaSouth AfricaSouth AmericaSouth Central AsiaSouth Eastern AsiaSouthern EuropeSpainSri LankaSt. Vincent and the GrenadinesSudanSwitzerlandSyriaTaiwanThailandTrinidad and TobagoTurkeyUgandaUkraineUruguayUzbekistanVenezuelaVietnamWest IndiesWestern AfricaWestern AsiaWestern EuropeYemenZaireZimbabweAzores
1st Grade
Income
Poverty
Unemployment
Labor Participation
Family Structure
Vehicle Availability
Education Level
Disability

1st Grade Comparison

Immigrants from Sweden

Sub-Saharan Africans

Exceptional
Tragic
98.3%
1ST GRADE
99.1/ 100
METRIC RATING
83rd/ 347
METRIC RANK
97.7%
1ST GRADE
3.6/ 100
METRIC RATING
228th/ 347
METRIC RANK

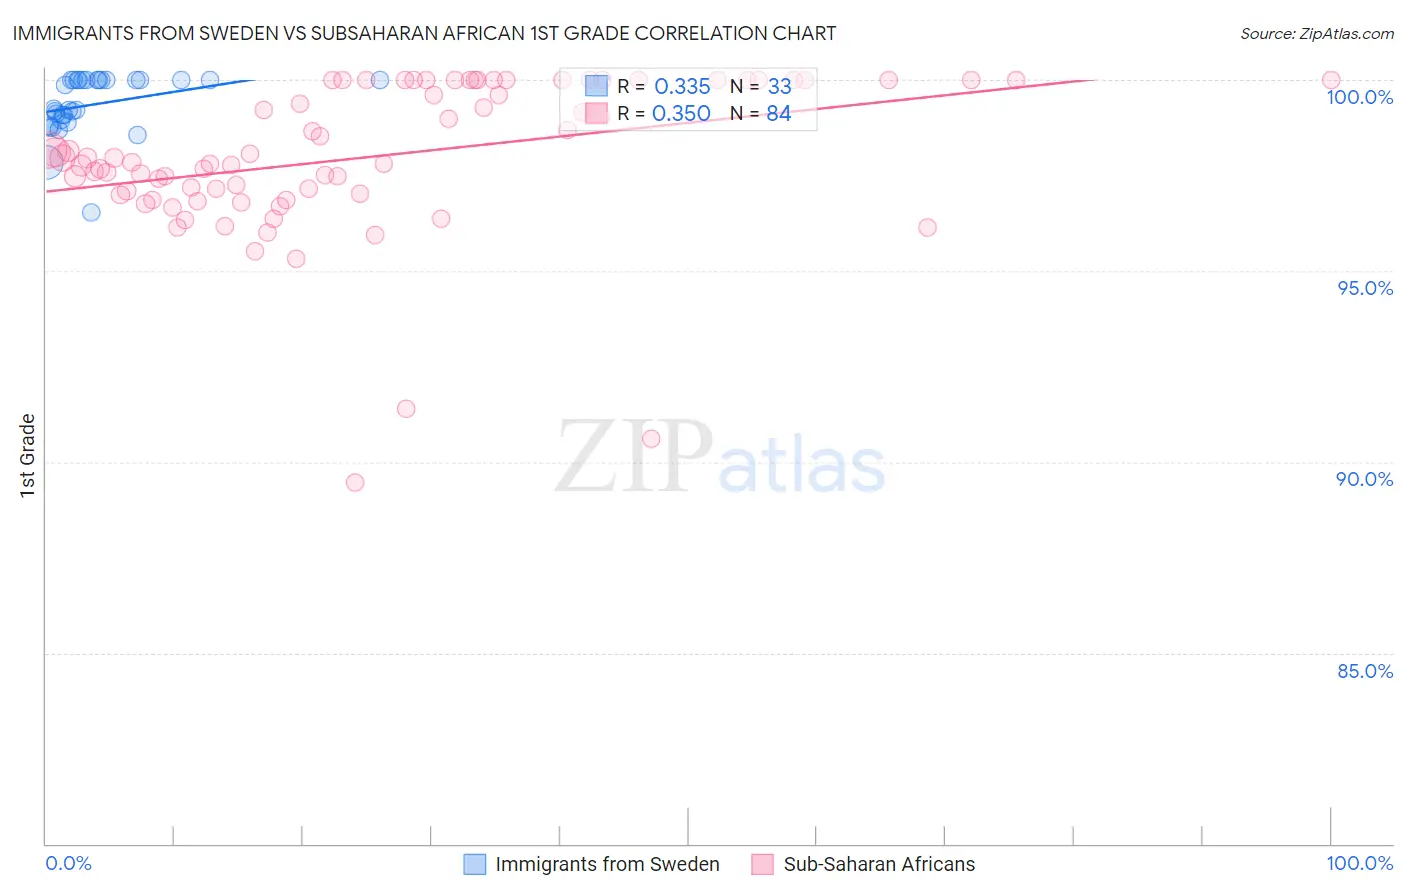
Immigrants from Sweden vs Subsaharan African 1st Grade Correlation Chart

The statistical analysis conducted on geographies consisting of 164,737,092 people shows a mild positive correlation between the proportion of Immigrants from Sweden and percentage of population with at least 1st grade education in the United States with a correlation coefficient (R) of 0.335 and weighted average of 98.3%. Similarly, the statistical analysis conducted on geographies consisting of 508,209,936 people shows a mild positive correlation between the proportion of Sub-Saharan Africans and percentage of population with at least 1st grade education in the United States with a correlation coefficient (R) of 0.350 and weighted average of 97.7%, a difference of 0.62%.
Immigrants from Sweden vs Subsaharan African 1st Grade

1st Grade Correlation Summary

MeasurementImmigrants from SwedenSubsaharan African
Minimum96.5%89.5%
Maximum100.0%100.0%
Range3.5%10.5%
Mean99.4%98.0%
Median99.2%97.9%
Interquartile 25% (IQ1)98.9%97.0%
Interquartile 75% (IQ3)100.0%100.0%
Interquartile Range (IQR)1.1%3.0%
Standard Deviation (Sample)0.78%2.0%
Standard Deviation (Population)0.77%2.0%

Similar Demographics by 1st Grade

Demographics Similar to Immigrants from Sweden by 1st Grade

In terms of 1st grade, the demographic groups most similar to Immigrants from Sweden are Delaware (98.3%, a difference of 0.0%), Hopi (98.3%, a difference of 0.0%), Immigrants from Denmark (98.3%, a difference of 0.0%), Immigrants from Belgium (98.3%, a difference of 0.010%), and Immigrants from Lithuania (98.3%, a difference of 0.010%).
DemographicsRating | Rank1st Grade
Shoshone
99.3
/100
|
#76
Exceptional
98.3%
Immigrants | England
99.3
/100
|
#77
Exceptional
98.3%
Immigrants | Belgium
99.2
/100
|
#78
Exceptional
98.3%
Immigrants | Lithuania
99.2
/100
|
#79
Exceptional
98.3%
Osage
99.2
/100
|
#80
Exceptional
98.3%
Potawatomi
99.1
/100
|
#81
Exceptional
98.3%
Icelanders
99.1
/100
|
#82
Exceptional
98.3%
Immigrants | Sweden
99.1
/100
|
#83
Exceptional
98.3%
Delaware
99.1
/100
|
#84
Exceptional
98.3%
Hopi
99.0
/100
|
#85
Exceptional
98.3%
Immigrants | Denmark
99.0
/100
|
#86
Exceptional
98.3%
Immigrants | Australia
99.0
/100
|
#87
Exceptional
98.3%
Zimbabweans
98.9
/100
|
#88
Exceptional
98.3%
Immigrants | South Africa
98.8
/100
|
#89
Exceptional
98.3%
Ukrainians
98.8
/100
|
#90
Exceptional
98.3%

Demographics Similar to Sub-Saharan Africans by 1st Grade

In terms of 1st grade, the demographic groups most similar to Sub-Saharan Africans are Sudanese (97.7%, a difference of 0.0%), Sierra Leonean (97.7%, a difference of 0.0%), Immigrants from Costa Rica (97.7%, a difference of 0.0%), Senegalese (97.7%, a difference of 0.0%), and Immigrants from Sudan (97.7%, a difference of 0.010%).
DemographicsRating | Rank1st Grade
Immigrants | Sudan
4.3
/100
|
#221
Tragic
97.7%
Immigrants | Syria
4.2
/100
|
#222
Tragic
97.7%
Immigrants | Zaire
4.1
/100
|
#223
Tragic
97.7%
Iraqis
4.0
/100
|
#224
Tragic
97.7%
Immigrants | Nepal
4.0
/100
|
#225
Tragic
97.7%
Sudanese
3.7
/100
|
#226
Tragic
97.7%
Sierra Leoneans
3.6
/100
|
#227
Tragic
97.7%
Sub-Saharan Africans
3.6
/100
|
#228
Tragic
97.7%
Immigrants | Costa Rica
3.5
/100
|
#229
Tragic
97.7%
Senegalese
3.5
/100
|
#230
Tragic
97.7%
Puerto Ricans
3.0
/100
|
#231
Tragic
97.7%
Immigrants | Uruguay
2.5
/100
|
#232
Tragic
97.6%
Immigrants | Pakistan
2.2
/100
|
#233
Tragic
97.6%
Colombians
2.2
/100
|
#234
Tragic
97.6%
Immigrants | Malaysia
2.1
/100
|
#235
Tragic
97.6%