Immigrants from Southern Europe vs Iroquois 2nd Grade
COMPARE
Immigrants from Southern Europe
Iroquois
2nd Grade
2nd Grade Comparison
Immigrants from Southern Europe
Iroquois
97.8%
2ND GRADE
18.1/ 100
METRIC RATING
205th/ 347
METRIC RANK
98.1%
2ND GRADE
94.1/ 100
METRIC RATING
125th/ 347
METRIC RANK
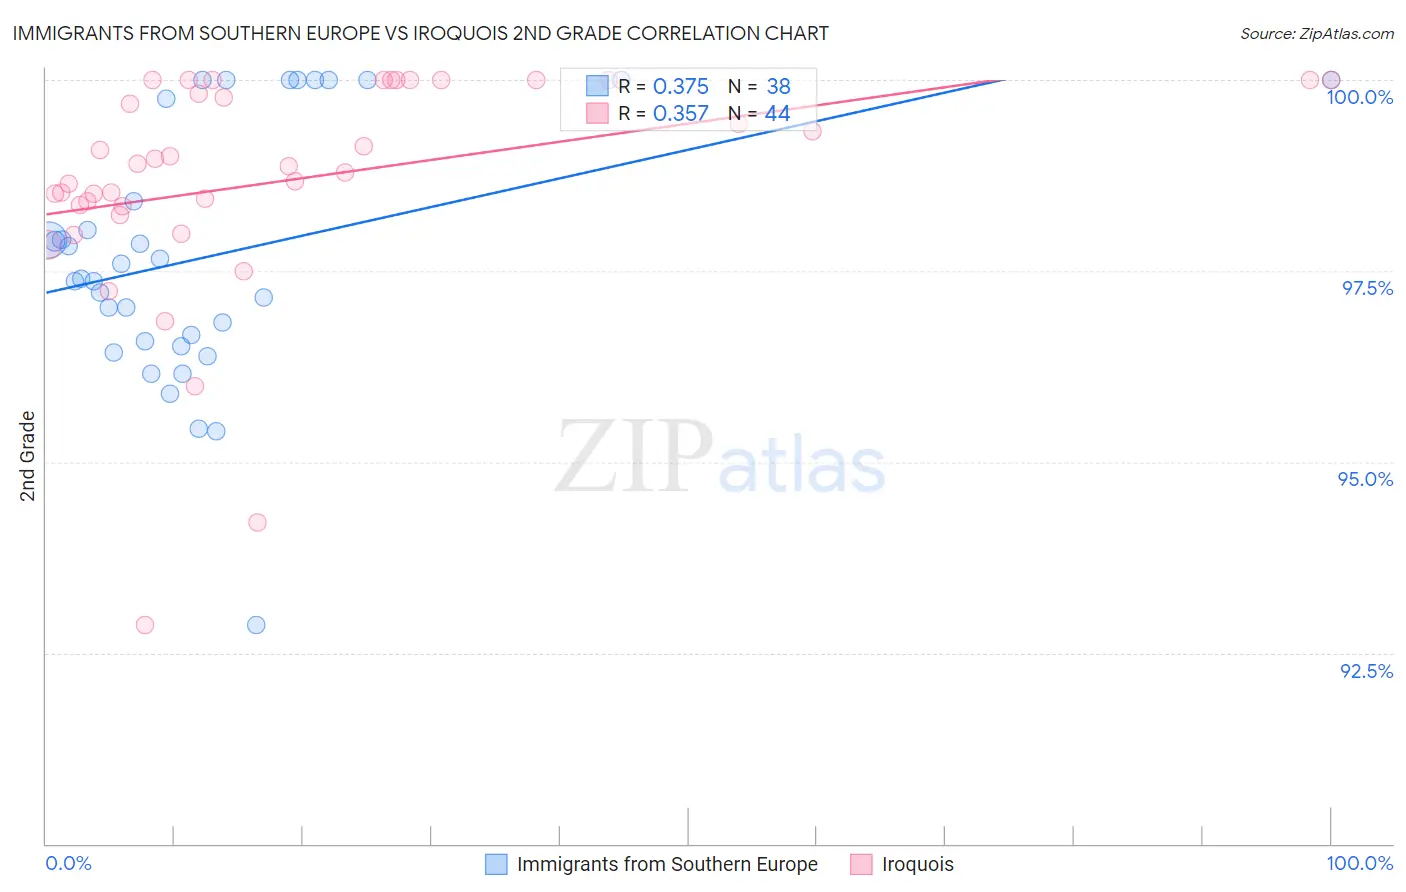
Immigrants from Southern Europe vs Iroquois 2nd Grade Correlation Chart
The statistical analysis conducted on geographies consisting of 402,804,595 people shows a mild positive correlation between the proportion of Immigrants from Southern Europe and percentage of population with at least 2nd grade education in the United States with a correlation coefficient (R) of 0.375 and weighted average of 97.8%. Similarly, the statistical analysis conducted on geographies consisting of 207,308,056 people shows a mild positive correlation between the proportion of Iroquois and percentage of population with at least 2nd grade education in the United States with a correlation coefficient (R) of 0.357 and weighted average of 98.1%, a difference of 0.34%.
2nd Grade Correlation Summary
| Measurement | Immigrants from Southern Europe | Iroquois |
| Minimum | 92.9% | 92.9% |
| Maximum | 100.0% | 100.0% |
| Range | 7.1% | 7.1% |
| Mean | 97.7% | 98.7% |
| Median | 97.5% | 98.9% |
| Interquartile 25% (IQ1) | 96.6% | 98.4% |
| Interquartile 75% (IQ3) | 99.8% | 100.0% |
| Interquartile Range (IQR) | 3.2% | 1.6% |
| Standard Deviation (Sample) | 1.7% | 1.5% |
| Standard Deviation (Population) | 1.7% | 1.5% |
Similar Demographics by 2nd Grade
Demographics Similar to Immigrants from Southern Europe by 2nd Grade
In terms of 2nd grade, the demographic groups most similar to Immigrants from Southern Europe are Immigrants from Albania (97.8%, a difference of 0.0%), Immigrants from Chile (97.7%, a difference of 0.0%), Immigrants from Lebanon (97.8%, a difference of 0.010%), Tohono O'odham (97.8%, a difference of 0.010%), and Immigrants from Ukraine (97.8%, a difference of 0.010%).
| Demographics | Rating | Rank | 2nd Grade |
| Guamanians/Chamorros | 25.7 /100 | #198 | Fair 97.8% |
| Immigrants | Egypt | 24.4 /100 | #199 | Fair 97.8% |
| Immigrants | Lebanon | 20.9 /100 | #200 | Fair 97.8% |
| Tohono O'odham | 20.9 /100 | #201 | Fair 97.8% |
| Immigrants | Ukraine | 20.5 /100 | #202 | Fair 97.8% |
| Yuman | 20.0 /100 | #203 | Fair 97.8% |
| Immigrants | Albania | 18.4 /100 | #204 | Poor 97.8% |
| Immigrants | Southern Europe | 18.1 /100 | #205 | Poor 97.8% |
| Immigrants | Chile | 17.3 /100 | #206 | Poor 97.7% |
| Africans | 15.6 /100 | #207 | Poor 97.7% |
| Immigrants | Northern Africa | 12.3 /100 | #208 | Poor 97.7% |
| Immigrants | Oceania | 10.9 /100 | #209 | Poor 97.7% |
| Costa Ricans | 10.5 /100 | #210 | Poor 97.7% |
| Laotians | 9.9 /100 | #211 | Tragic 97.7% |
| Immigrants | Bahamas | 8.4 /100 | #212 | Tragic 97.7% |
Demographics Similar to Iroquois by 2nd Grade
In terms of 2nd grade, the demographic groups most similar to Iroquois are Immigrants from Zimbabwe (98.1%, a difference of 0.0%), Lebanese (98.1%, a difference of 0.0%), Immigrants from Japan (98.1%, a difference of 0.0%), Menominee (98.1%, a difference of 0.0%), and Syrian (98.1%, a difference of 0.0%).
| Demographics | Rating | Rank | 2nd Grade |
| Immigrants | France | 95.6 /100 | #118 | Exceptional 98.1% |
| Thais | 95.3 /100 | #119 | Exceptional 98.1% |
| Okinawans | 94.9 /100 | #120 | Exceptional 98.1% |
| Immigrants | Zimbabwe | 94.4 /100 | #121 | Exceptional 98.1% |
| Lebanese | 94.2 /100 | #122 | Exceptional 98.1% |
| Immigrants | Japan | 94.1 /100 | #123 | Exceptional 98.1% |
| Menominee | 94.1 /100 | #124 | Exceptional 98.1% |
| Iroquois | 94.1 /100 | #125 | Exceptional 98.1% |
| Syrians | 94.0 /100 | #126 | Exceptional 98.1% |
| Immigrants | Saudi Arabia | 93.6 /100 | #127 | Exceptional 98.1% |
| Immigrants | Serbia | 92.3 /100 | #128 | Exceptional 98.1% |
| Immigrants | Croatia | 92.1 /100 | #129 | Exceptional 98.1% |
| Seminole | 91.1 /100 | #130 | Exceptional 98.0% |
| Immigrants | Europe | 91.1 /100 | #131 | Exceptional 98.0% |
| Spaniards | 90.7 /100 | #132 | Exceptional 98.0% |