Immigrants from Scotland vs Iroquois 2nd Grade

COMPARE

Immigrants from Scotland
Race
Ancestry
AfghanAfricanAlaska NativeAlaskan AthabascanAlbanianAleutAlsatianAmericanApacheArabArapahoArgentineanArmenianAssyrian/Chaldean/SyriacAustralianAustrianBahamianBangladeshiBarbadianBasqueBelgianBelizeanBermudanBhutaneseBlackfeetBolivianBrazilianBritishBritish West IndianBulgarianBurmeseCajunCambodianCanadianCape VerdeanCarpatho RusynCelticCentral AmericanCentral American IndianCherokeeCheyenneChickasawChileanChineseChippewaChoctawColombianColvilleComancheCosta RicanCreeCreekCroatianCrowCubanCypriotCzechCzechoslovakianDanishDelawareDominicanDutchDutch West IndianEastern EuropeanEcuadorianEgyptianEnglishEstonianEthiopianEuropeanFijianFilipinoFinnishFrenchFrench American IndianFrench CanadianGermanGerman RussianGhanaianGreekGuamanian/ChamorroGuatemalanGuyaneseHaitianHmongHonduranHopiHoumaHungarianIcelanderIndian (Asian)IndonesianInupiatIranianIraqiIrishIsraeliItalianJamaicanJapaneseJordanianKenyanKiowaKoreanLaotianLatvianLebaneseLiberianLithuanianLumbeeLuxembourgerMacedonianMalaysianMalteseMarshalleseMenomineeMexicanMexican American IndianMongolianMoroccanNative HawaiianNavajoNepaleseNew ZealanderNicaraguanNigerianNorthern EuropeanNorwegianOkinawanOsageOttawaPaiutePakistaniPalestinianPanamanianParaguayanPennsylvania GermanPeruvianPimaPolishPortuguesePotawatomiPuebloPuerto RicanPuget Sound SalishRomanianRussianSalvadoranSamoanScandinavianScotch-IrishScottishSeminoleSenegaleseSerbianShoshoneSierra LeoneanSiouxSlavicSlovakSloveneSomaliSouth AfricanSouth AmericanSouth American IndianSoviet UnionSpaniardSpanishSpanish AmericanSpanish American IndianSri LankanSubsaharan AfricanSudaneseSwedishSwissSyrianTaiwaneseThaiTlingit-HaidaTohono O'OdhamTonganTrinidadian and TobagonianTsimshianTurkishU.S. Virgin IslanderUgandanUkrainianUruguayanUteVenezuelanVietnameseWelshWest IndianYakamaYaquiYugoslavianYumanYup'ikZimbabwean
Immigration
NonimmigrantsImmigrantsAfghanistanAfricaAlbaniaArgentinaArmeniaAsiaAustraliaAustriaBahamasBangladeshBarbadosBelarusBelgiumBelizeBoliviaBosnia and HerzegovinaBrazilBulgariaBurma/MyanmarCabo VerdeCambodiaCameroonCanadaCaribbeanCentral AmericaChileChinaColombiaCongoCosta RicaCroatiaCubaCzechoslovakiaDenmarkDominicaDominican RepublicEastern AfricaEastern AsiaEastern EuropeEcuadorEgyptEl SalvadorEnglandEritreaEthiopiaEuropeFijiFranceGermanyGhanaGreeceGrenadaGuatemalaGuyanaHaitiHondurasHong KongHungaryIndiaIndonesiaIranIraqIrelandIsraelItalyJamaicaJapanJordanKazakhstanKenyaKoreaKuwaitLaosLatin AmericaLatviaLebanonLiberiaLithuaniaMalaysiaMexicoMicronesiaMiddle AfricaMoldovaMoroccoNepalNetherlandsNicaraguaNigeriaNorth AmericaNorth MacedoniaNorthern AfricaNorthern EuropeNorwayOceaniaPakistanPanamaPeruPhilippinesPolandPortugalRomaniaRussiaSaudi ArabiaScotlandSenegalSerbiaSierra LeoneSingaporeSomaliaSouth AfricaSouth AmericaSouth Central AsiaSouth Eastern AsiaSouthern EuropeSpainSri LankaSt. Vincent and the GrenadinesSudanSwedenSwitzerlandSyriaTaiwanThailandTrinidad and TobagoTurkeyUgandaUkraineUruguayUzbekistanVenezuelaVietnamWest IndiesWestern AfricaWestern AsiaWestern EuropeYemenZaireZimbabweAzores
Iroquois
Race
Ancestry
AfghanAfricanAlaska NativeAlaskan AthabascanAlbanianAleutAlsatianAmericanApacheArabArapahoArgentineanArmenianAssyrian/Chaldean/SyriacAustralianAustrianBahamianBangladeshiBarbadianBasqueBelgianBelizeanBermudanBhutaneseBlackfeetBolivianBrazilianBritishBritish West IndianBulgarianBurmeseCajunCambodianCanadianCape VerdeanCarpatho RusynCelticCentral AmericanCentral American IndianCherokeeCheyenneChickasawChileanChineseChippewaChoctawColombianColvilleComancheCosta RicanCreeCreekCroatianCrowCubanCypriotCzechCzechoslovakianDanishDelawareDominicanDutchDutch West IndianEastern EuropeanEcuadorianEgyptianEnglishEstonianEthiopianEuropeanFijianFilipinoFinnishFrenchFrench American IndianFrench CanadianGermanGerman RussianGhanaianGreekGuamanian/ChamorroGuatemalanGuyaneseHaitianHmongHonduranHopiHoumaHungarianIcelanderIndian (Asian)IndonesianInupiatIranianIraqiIrishIroquoisIsraeliItalianJamaicanJapaneseJordanianKenyanKiowaKoreanLaotianLatvianLebaneseLiberianLithuanianLumbeeLuxembourgerMacedonianMalaysianMalteseMarshalleseMenomineeMexicanMexican American IndianMongolianMoroccanNative HawaiianNavajoNepaleseNew ZealanderNicaraguanNigerianNorthern EuropeanNorwegianOkinawanOsageOttawaPaiutePakistaniPalestinianPanamanianParaguayanPennsylvania GermanPeruvianPimaPolishPortuguesePotawatomiPuebloPuerto RicanPuget Sound SalishRomanianRussianSalvadoranSamoanScandinavianScotch-IrishScottishSeminoleSenegaleseSerbianShoshoneSierra LeoneanSiouxSlavicSlovakSloveneSomaliSouth AfricanSouth AmericanSouth American IndianSoviet UnionSpaniardSpanishSpanish AmericanSpanish American IndianSri LankanSubsaharan AfricanSudaneseSwedishSwissSyrianTaiwaneseThaiTlingit-HaidaTohono O'OdhamTonganTrinidadian and TobagonianTsimshianTurkishU.S. Virgin IslanderUgandanUkrainianUruguayanUteVenezuelanVietnameseWelshWest IndianYakamaYaquiYugoslavianYumanYup'ikZimbabwean
Immigration
NonimmigrantsImmigrantsAfghanistanAfricaAlbaniaArgentinaArmeniaAsiaAustraliaAustriaBahamasBangladeshBarbadosBelarusBelgiumBelizeBoliviaBosnia and HerzegovinaBrazilBulgariaBurma/MyanmarCabo VerdeCambodiaCameroonCanadaCaribbeanCentral AmericaChileChinaColombiaCongoCosta RicaCroatiaCubaCzechoslovakiaDenmarkDominicaDominican RepublicEastern AfricaEastern AsiaEastern EuropeEcuadorEgyptEl SalvadorEnglandEritreaEthiopiaEuropeFijiFranceGermanyGhanaGreeceGrenadaGuatemalaGuyanaHaitiHondurasHong KongHungaryIndiaIndonesiaIranIraqIrelandIsraelItalyJamaicaJapanJordanKazakhstanKenyaKoreaKuwaitLaosLatin AmericaLatviaLebanonLiberiaLithuaniaMalaysiaMexicoMicronesiaMiddle AfricaMoldovaMoroccoNepalNetherlandsNicaraguaNigeriaNorth AmericaNorth MacedoniaNorthern AfricaNorthern EuropeNorwayOceaniaPakistanPanamaPeruPhilippinesPolandPortugalRomaniaRussiaSaudi ArabiaSenegalSerbiaSierra LeoneSingaporeSomaliaSouth AfricaSouth AmericaSouth Central AsiaSouth Eastern AsiaSouthern EuropeSpainSri LankaSt. Vincent and the GrenadinesSudanSwedenSwitzerlandSyriaTaiwanThailandTrinidad and TobagoTurkeyUgandaUkraineUruguayUzbekistanVenezuelaVietnamWest IndiesWestern AfricaWestern AsiaWestern EuropeYemenZaireZimbabweAzores
2nd Grade
Income
Poverty
Unemployment
Labor Participation
Family Structure
Vehicle Availability
Education Level
Disability

2nd Grade Comparison

Immigrants from Scotland

Iroquois

Exceptional
Exceptional
98.3%
2ND GRADE
99.8/ 100
METRIC RATING
55th/ 347
METRIC RANK
98.1%
2ND GRADE
94.1/ 100
METRIC RATING
125th/ 347
METRIC RANK

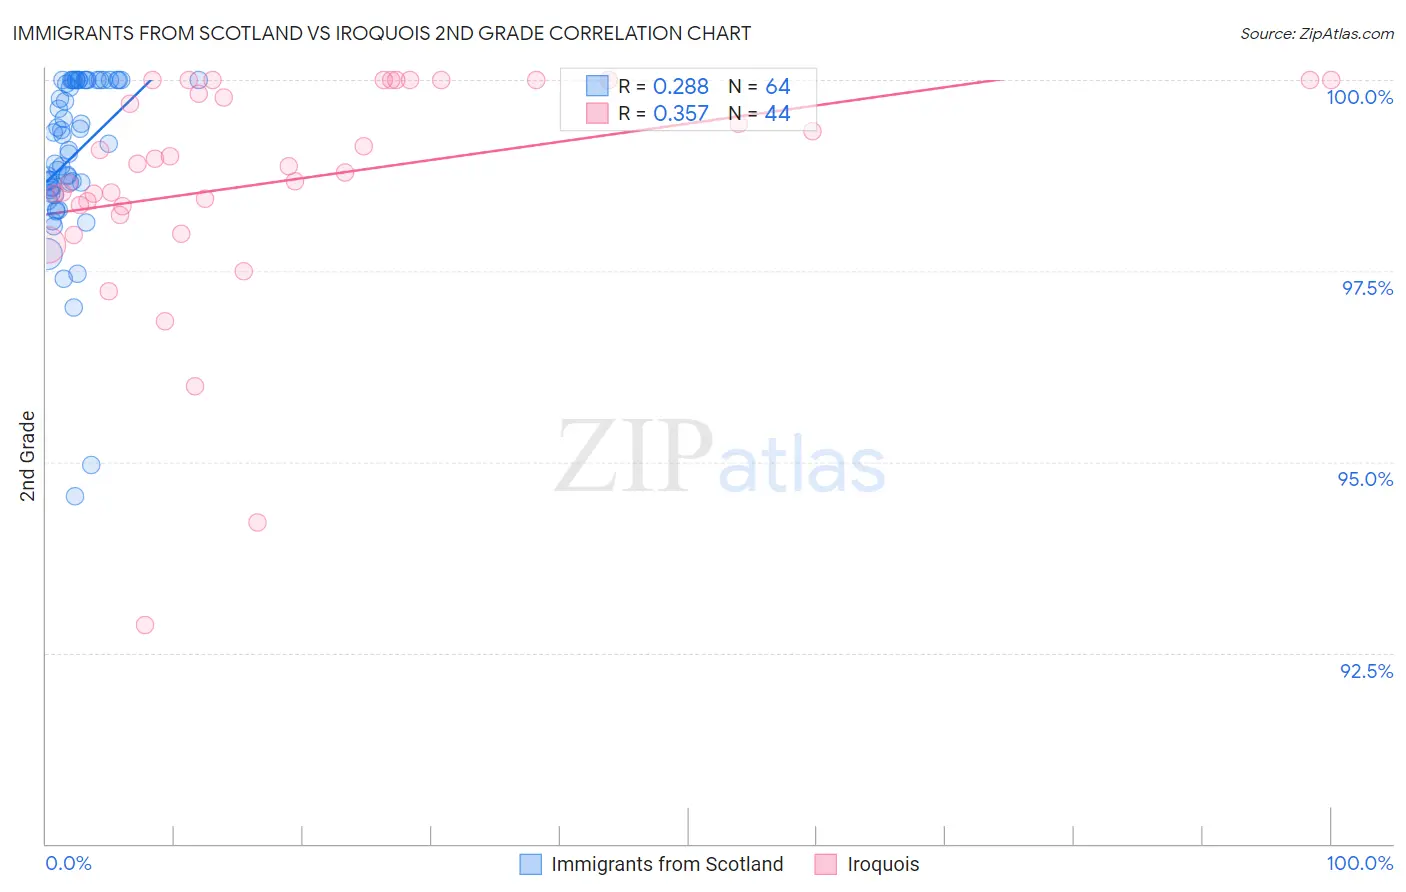
Immigrants from Scotland vs Iroquois 2nd Grade Correlation Chart

The statistical analysis conducted on geographies consisting of 196,398,887 people shows a weak positive correlation between the proportion of Immigrants from Scotland and percentage of population with at least 2nd grade education in the United States with a correlation coefficient (R) of 0.288 and weighted average of 98.3%. Similarly, the statistical analysis conducted on geographies consisting of 207,308,056 people shows a mild positive correlation between the proportion of Iroquois and percentage of population with at least 2nd grade education in the United States with a correlation coefficient (R) of 0.357 and weighted average of 98.1%, a difference of 0.27%.
Immigrants from Scotland vs Iroquois 2nd Grade

2nd Grade Correlation Summary

MeasurementImmigrants from ScotlandIroquois
Minimum94.6%92.9%
Maximum100.0%100.0%
Range5.4%7.1%
Mean99.0%98.7%
Median99.1%98.9%
Interquartile 25% (IQ1)98.6%98.4%
Interquartile 75% (IQ3)100.0%100.0%
Interquartile Range (IQR)1.4%1.6%
Standard Deviation (Sample)1.1%1.5%
Standard Deviation (Population)1.1%1.5%

Similar Demographics by 2nd Grade

Demographics Similar to Immigrants from Scotland by 2nd Grade

In terms of 2nd grade, the demographic groups most similar to Immigrants from Scotland are Pueblo (98.3%, a difference of 0.0%), Kiowa (98.3%, a difference of 0.0%), Celtic (98.4%, a difference of 0.010%), White/Caucasian (98.4%, a difference of 0.010%), and Estonian (98.4%, a difference of 0.010%).
DemographicsRating | Rank2nd Grade
Czechoslovakians
99.9
/100
|
#48
Exceptional
98.4%
Celtics
99.8
/100
|
#49
Exceptional
98.4%
Whites/Caucasians
99.8
/100
|
#50
Exceptional
98.4%
Estonians
99.8
/100
|
#51
Exceptional
98.4%
Australians
99.8
/100
|
#52
Exceptional
98.4%
Pueblo
99.8
/100
|
#53
Exceptional
98.3%
Kiowa
99.8
/100
|
#54
Exceptional
98.3%
Immigrants | Scotland
99.8
/100
|
#55
Exceptional
98.3%
Americans
99.8
/100
|
#56
Exceptional
98.3%
Austrians
99.8
/100
|
#57
Exceptional
98.3%
Bulgarians
99.8
/100
|
#58
Exceptional
98.3%
Slavs
99.8
/100
|
#59
Exceptional
98.3%
Creek
99.8
/100
|
#60
Exceptional
98.3%
Immigrants | Canada
99.8
/100
|
#61
Exceptional
98.3%
Greeks
99.8
/100
|
#62
Exceptional
98.3%

Demographics Similar to Iroquois by 2nd Grade

In terms of 2nd grade, the demographic groups most similar to Iroquois are Immigrants from Zimbabwe (98.1%, a difference of 0.0%), Lebanese (98.1%, a difference of 0.0%), Immigrants from Japan (98.1%, a difference of 0.0%), Menominee (98.1%, a difference of 0.0%), and Syrian (98.1%, a difference of 0.0%).
DemographicsRating | Rank2nd Grade
Immigrants | France
95.6
/100
|
#118
Exceptional
98.1%
Thais
95.3
/100
|
#119
Exceptional
98.1%
Okinawans
94.9
/100
|
#120
Exceptional
98.1%
Immigrants | Zimbabwe
94.4
/100
|
#121
Exceptional
98.1%
Lebanese
94.2
/100
|
#122
Exceptional
98.1%
Immigrants | Japan
94.1
/100
|
#123
Exceptional
98.1%
Menominee
94.1
/100
|
#124
Exceptional
98.1%
Iroquois
94.1
/100
|
#125
Exceptional
98.1%
Syrians
94.0
/100
|
#126
Exceptional
98.1%
Immigrants | Saudi Arabia
93.6
/100
|
#127
Exceptional
98.1%
Immigrants | Serbia
92.3
/100
|
#128
Exceptional
98.1%
Immigrants | Croatia
92.1
/100
|
#129
Exceptional
98.1%
Seminole
91.1
/100
|
#130
Exceptional
98.0%
Immigrants | Europe
91.1
/100
|
#131
Exceptional
98.0%
Spaniards
90.7
/100
|
#132
Exceptional
98.0%