Immigrants from South Eastern Asia vs Ugandan Doctorate Degree
COMPARE
Immigrants from South Eastern Asia
Ugandan
Doctorate Degree
Doctorate Degree Comparison
Immigrants from South Eastern Asia
Ugandans
1.7%
DOCTORATE DEGREE
14.7/ 100
METRIC RATING
212th/ 347
METRIC RANK
2.2%
DOCTORATE DEGREE
99.7/ 100
METRIC RATING
80th/ 347
METRIC RANK
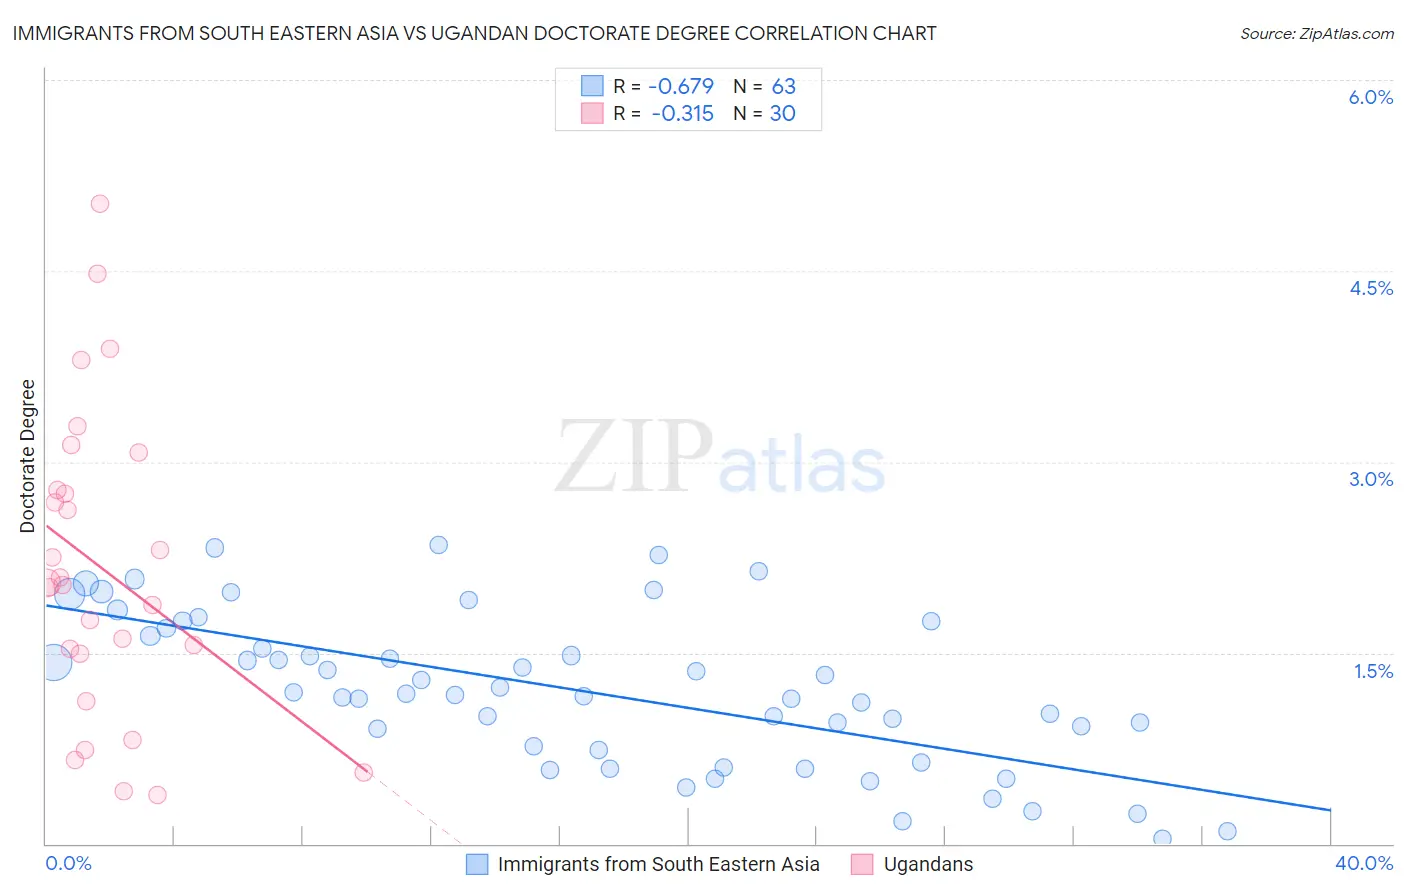
Immigrants from South Eastern Asia vs Ugandan Doctorate Degree Correlation Chart
The statistical analysis conducted on geographies consisting of 502,144,832 people shows a significant negative correlation between the proportion of Immigrants from South Eastern Asia and percentage of population with at least doctorate degree education in the United States with a correlation coefficient (R) of -0.679 and weighted average of 1.7%. Similarly, the statistical analysis conducted on geographies consisting of 93,908,967 people shows a mild negative correlation between the proportion of Ugandans and percentage of population with at least doctorate degree education in the United States with a correlation coefficient (R) of -0.315 and weighted average of 2.2%, a difference of 29.4%.
Doctorate Degree Correlation Summary
| Measurement | Immigrants from South Eastern Asia | Ugandan |
| Minimum | 0.043% | 0.38% |
| Maximum | 2.3% | 5.0% |
| Range | 2.3% | 4.6% |
| Mean | 1.2% | 2.2% |
| Median | 1.2% | 2.0% |
| Interquartile 25% (IQ1) | 0.74% | 1.5% |
| Interquartile 75% (IQ3) | 1.7% | 2.8% |
| Interquartile Range (IQR) | 0.96% | 1.3% |
| Standard Deviation (Sample) | 0.60% | 1.2% |
| Standard Deviation (Population) | 0.59% | 1.2% |
Similar Demographics by Doctorate Degree
Demographics Similar to Immigrants from South Eastern Asia by Doctorate Degree
In terms of doctorate degree, the demographic groups most similar to Immigrants from South Eastern Asia are Immigrants from Armenia (1.7%, a difference of 0.13%), Tongan (1.7%, a difference of 0.14%), Korean (1.7%, a difference of 0.15%), Pueblo (1.7%, a difference of 0.15%), and Immigrants from Western Africa (1.7%, a difference of 0.22%).
| Demographics | Rating | Rank | Doctorate Degree |
| Venezuelans | 19.5 /100 | #205 | Poor 1.7% |
| Immigrants | Peru | 17.6 /100 | #206 | Poor 1.7% |
| Yugoslavians | 17.1 /100 | #207 | Poor 1.7% |
| Colombians | 16.1 /100 | #208 | Poor 1.7% |
| Immigrants | Western Africa | 15.4 /100 | #209 | Poor 1.7% |
| Tongans | 15.1 /100 | #210 | Poor 1.7% |
| Immigrants | Armenia | 15.1 /100 | #211 | Poor 1.7% |
| Immigrants | South Eastern Asia | 14.7 /100 | #212 | Poor 1.7% |
| Koreans | 14.2 /100 | #213 | Poor 1.7% |
| Pueblo | 14.2 /100 | #214 | Poor 1.7% |
| Alaskan Athabascans | 13.8 /100 | #215 | Poor 1.7% |
| Immigrants | Burma/Myanmar | 13.5 /100 | #216 | Poor 1.7% |
| Spanish Americans | 12.9 /100 | #217 | Poor 1.7% |
| Tlingit-Haida | 11.9 /100 | #218 | Poor 1.7% |
| Immigrants | Iraq | 10.7 /100 | #219 | Poor 1.7% |
Demographics Similar to Ugandans by Doctorate Degree
In terms of doctorate degree, the demographic groups most similar to Ugandans are Immigrants from Argentina (2.2%, a difference of 0.050%), Northern European (2.2%, a difference of 0.28%), Immigrants from Belarus (2.2%, a difference of 0.35%), Immigrants from Uganda (2.2%, a difference of 0.59%), and Immigrants from Lithuania (2.2%, a difference of 0.77%).
| Demographics | Rating | Rank | Doctorate Degree |
| Immigrants | Bulgaria | 99.8 /100 | #73 | Exceptional 2.3% |
| Immigrants | North America | 99.8 /100 | #74 | Exceptional 2.2% |
| Immigrants | Western Asia | 99.8 /100 | #75 | Exceptional 2.2% |
| Immigrants | Hungary | 99.8 /100 | #76 | Exceptional 2.2% |
| Immigrants | Lebanon | 99.8 /100 | #77 | Exceptional 2.2% |
| Immigrants | Belarus | 99.7 /100 | #78 | Exceptional 2.2% |
| Northern Europeans | 99.7 /100 | #79 | Exceptional 2.2% |
| Ugandans | 99.7 /100 | #80 | Exceptional 2.2% |
| Immigrants | Argentina | 99.7 /100 | #81 | Exceptional 2.2% |
| Immigrants | Uganda | 99.6 /100 | #82 | Exceptional 2.2% |
| Immigrants | Lithuania | 99.6 /100 | #83 | Exceptional 2.2% |
| Immigrants | England | 99.6 /100 | #84 | Exceptional 2.2% |
| Immigrants | Brazil | 99.6 /100 | #85 | Exceptional 2.2% |
| Egyptians | 99.4 /100 | #86 | Exceptional 2.2% |
| Immigrants | Zimbabwe | 99.4 /100 | #87 | Exceptional 2.2% |