Immigrants from Scotland vs Spanish American Indian Kindergarten

COMPARE

Immigrants from Scotland
Race
Ancestry
AfghanAfricanAlaska NativeAlaskan AthabascanAlbanianAleutAlsatianAmericanApacheArabArapahoArgentineanArmenianAssyrian/Chaldean/SyriacAustralianAustrianBahamianBangladeshiBarbadianBasqueBelgianBelizeanBermudanBhutaneseBlackfeetBolivianBrazilianBritishBritish West IndianBulgarianBurmeseCajunCambodianCanadianCape VerdeanCarpatho RusynCelticCentral AmericanCentral American IndianCherokeeCheyenneChickasawChileanChineseChippewaChoctawColombianColvilleComancheCosta RicanCreeCreekCroatianCrowCubanCypriotCzechCzechoslovakianDanishDelawareDominicanDutchDutch West IndianEastern EuropeanEcuadorianEgyptianEnglishEstonianEthiopianEuropeanFijianFilipinoFinnishFrenchFrench American IndianFrench CanadianGermanGerman RussianGhanaianGreekGuamanian/ChamorroGuatemalanGuyaneseHaitianHmongHonduranHopiHoumaHungarianIcelanderIndian (Asian)IndonesianInupiatIranianIraqiIrishIroquoisIsraeliItalianJamaicanJapaneseJordanianKenyanKiowaKoreanLaotianLatvianLebaneseLiberianLithuanianLumbeeLuxembourgerMacedonianMalaysianMalteseMarshalleseMenomineeMexicanMexican American IndianMongolianMoroccanNative HawaiianNavajoNepaleseNew ZealanderNicaraguanNigerianNorthern EuropeanNorwegianOkinawanOsageOttawaPaiutePakistaniPalestinianPanamanianParaguayanPennsylvania GermanPeruvianPimaPolishPortuguesePotawatomiPuebloPuerto RicanPuget Sound SalishRomanianRussianSalvadoranSamoanScandinavianScotch-IrishScottishSeminoleSenegaleseSerbianShoshoneSierra LeoneanSiouxSlavicSlovakSloveneSomaliSouth AfricanSouth AmericanSouth American IndianSoviet UnionSpaniardSpanishSpanish AmericanSri LankanSubsaharan AfricanSudaneseSwedishSwissSyrianTaiwaneseThaiTlingit-HaidaTohono O'OdhamTonganTrinidadian and TobagonianTsimshianTurkishU.S. Virgin IslanderUgandanUkrainianUruguayanUteVenezuelanVietnameseWelshWest IndianYakamaYaquiYugoslavianYumanYup'ikZimbabwean
Immigration
NonimmigrantsImmigrantsAfghanistanAfricaAlbaniaArgentinaArmeniaAsiaAustraliaAustriaBahamasBangladeshBarbadosBelarusBelgiumBelizeBoliviaBosnia and HerzegovinaBrazilBulgariaBurma/MyanmarCabo VerdeCambodiaCameroonCanadaCaribbeanCentral AmericaChileChinaColombiaCongoCosta RicaCroatiaCubaCzechoslovakiaDenmarkDominicaDominican RepublicEastern AfricaEastern AsiaEastern EuropeEcuadorEgyptEl SalvadorEnglandEritreaEthiopiaEuropeFijiFranceGermanyGhanaGreeceGrenadaGuatemalaGuyanaHaitiHondurasHong KongHungaryIndiaIndonesiaIranIraqIrelandIsraelItalyJamaicaJapanJordanKazakhstanKenyaKoreaKuwaitLaosLatin AmericaLatviaLebanonLiberiaLithuaniaMalaysiaMexicoMicronesiaMiddle AfricaMoldovaMoroccoNepalNetherlandsNicaraguaNigeriaNorth AmericaNorth MacedoniaNorthern AfricaNorthern EuropeNorwayOceaniaPakistanPanamaPeruPhilippinesPolandPortugalRomaniaRussiaSaudi ArabiaScotlandSenegalSerbiaSierra LeoneSingaporeSomaliaSouth AfricaSouth AmericaSouth Central AsiaSouth Eastern AsiaSouthern EuropeSpainSri LankaSt. Vincent and the GrenadinesSudanSwedenSwitzerlandSyriaTaiwanThailandTrinidad and TobagoTurkeyUgandaUkraineUruguayUzbekistanVenezuelaVietnamWest IndiesWestern AfricaWestern AsiaWestern EuropeYemenZaireZimbabweAzores
Spanish American Indian
Race
Ancestry
AfghanAfricanAlaska NativeAlaskan AthabascanAlbanianAleutAlsatianAmericanApacheArabArapahoArgentineanArmenianAssyrian/Chaldean/SyriacAustralianAustrianBahamianBangladeshiBarbadianBasqueBelgianBelizeanBermudanBhutaneseBlackfeetBolivianBrazilianBritishBritish West IndianBulgarianBurmeseCajunCambodianCanadianCape VerdeanCarpatho RusynCelticCentral AmericanCentral American IndianCherokeeCheyenneChickasawChileanChineseChippewaChoctawColombianColvilleComancheCosta RicanCreeCreekCroatianCrowCubanCypriotCzechCzechoslovakianDanishDelawareDominicanDutchDutch West IndianEastern EuropeanEcuadorianEgyptianEnglishEstonianEthiopianEuropeanFijianFilipinoFinnishFrenchFrench American IndianFrench CanadianGermanGerman RussianGhanaianGreekGuamanian/ChamorroGuatemalanGuyaneseHaitianHmongHonduranHopiHoumaHungarianIcelanderIndian (Asian)IndonesianInupiatIranianIraqiIrishIroquoisIsraeliItalianJamaicanJapaneseJordanianKenyanKiowaKoreanLaotianLatvianLebaneseLiberianLithuanianLumbeeLuxembourgerMacedonianMalaysianMalteseMarshalleseMenomineeMexicanMexican American IndianMongolianMoroccanNative HawaiianNavajoNepaleseNew ZealanderNicaraguanNigerianNorthern EuropeanNorwegianOkinawanOsageOttawaPaiutePakistaniPalestinianPanamanianParaguayanPennsylvania GermanPeruvianPimaPolishPortuguesePotawatomiPuebloPuerto RicanPuget Sound SalishRomanianRussianSalvadoranSamoanScandinavianScotch-IrishScottishSeminoleSenegaleseSerbianShoshoneSierra LeoneanSiouxSlavicSlovakSloveneSomaliSouth AfricanSouth AmericanSouth American IndianSoviet UnionSpaniardSpanishSpanish AmericanSpanish American IndianSri LankanSubsaharan AfricanSudaneseSwedishSwissSyrianTaiwaneseThaiTlingit-HaidaTohono O'OdhamTonganTrinidadian and TobagonianTsimshianTurkishU.S. Virgin IslanderUgandanUkrainianUruguayanUteVenezuelanVietnameseWelshWest IndianYakamaYaquiYugoslavianYumanYup'ikZimbabwean
Immigration
NonimmigrantsImmigrantsAfghanistanAfricaAlbaniaArgentinaArmeniaAsiaAustraliaAustriaBahamasBangladeshBarbadosBelarusBelgiumBelizeBoliviaBosnia and HerzegovinaBrazilBulgariaBurma/MyanmarCabo VerdeCambodiaCameroonCanadaCaribbeanCentral AmericaChileChinaColombiaCongoCosta RicaCroatiaCubaCzechoslovakiaDenmarkDominicaDominican RepublicEastern AfricaEastern AsiaEastern EuropeEcuadorEgyptEl SalvadorEnglandEritreaEthiopiaEuropeFijiFranceGermanyGhanaGreeceGrenadaGuatemalaGuyanaHaitiHondurasHong KongHungaryIndiaIndonesiaIranIraqIrelandIsraelItalyJamaicaJapanJordanKazakhstanKenyaKoreaKuwaitLaosLatin AmericaLatviaLebanonLiberiaLithuaniaMalaysiaMexicoMicronesiaMiddle AfricaMoldovaMoroccoNepalNetherlandsNicaraguaNigeriaNorth AmericaNorth MacedoniaNorthern AfricaNorthern EuropeNorwayOceaniaPakistanPanamaPeruPhilippinesPolandPortugalRomaniaRussiaSaudi ArabiaSenegalSerbiaSierra LeoneSingaporeSomaliaSouth AfricaSouth AmericaSouth Central AsiaSouth Eastern AsiaSouthern EuropeSpainSri LankaSt. Vincent and the GrenadinesSudanSwedenSwitzerlandSyriaTaiwanThailandTrinidad and TobagoTurkeyUgandaUkraineUruguayUzbekistanVenezuelaVietnamWest IndiesWestern AfricaWestern AsiaWestern EuropeYemenZaireZimbabweAzores
Kindergarten
Income
Poverty
Unemployment
Labor Participation
Family Structure
Vehicle Availability
Education Level
Disability

Kindergarten Comparison

Immigrants from Scotland

Spanish American Indians

Exceptional
Tragic
98.4%
KINDERGARTEN
99.8/ 100
METRIC RATING
55th/ 347
METRIC RANK
95.8%
KINDERGARTEN
0.0/ 100
METRIC RATING
347th/ 347
METRIC RANK

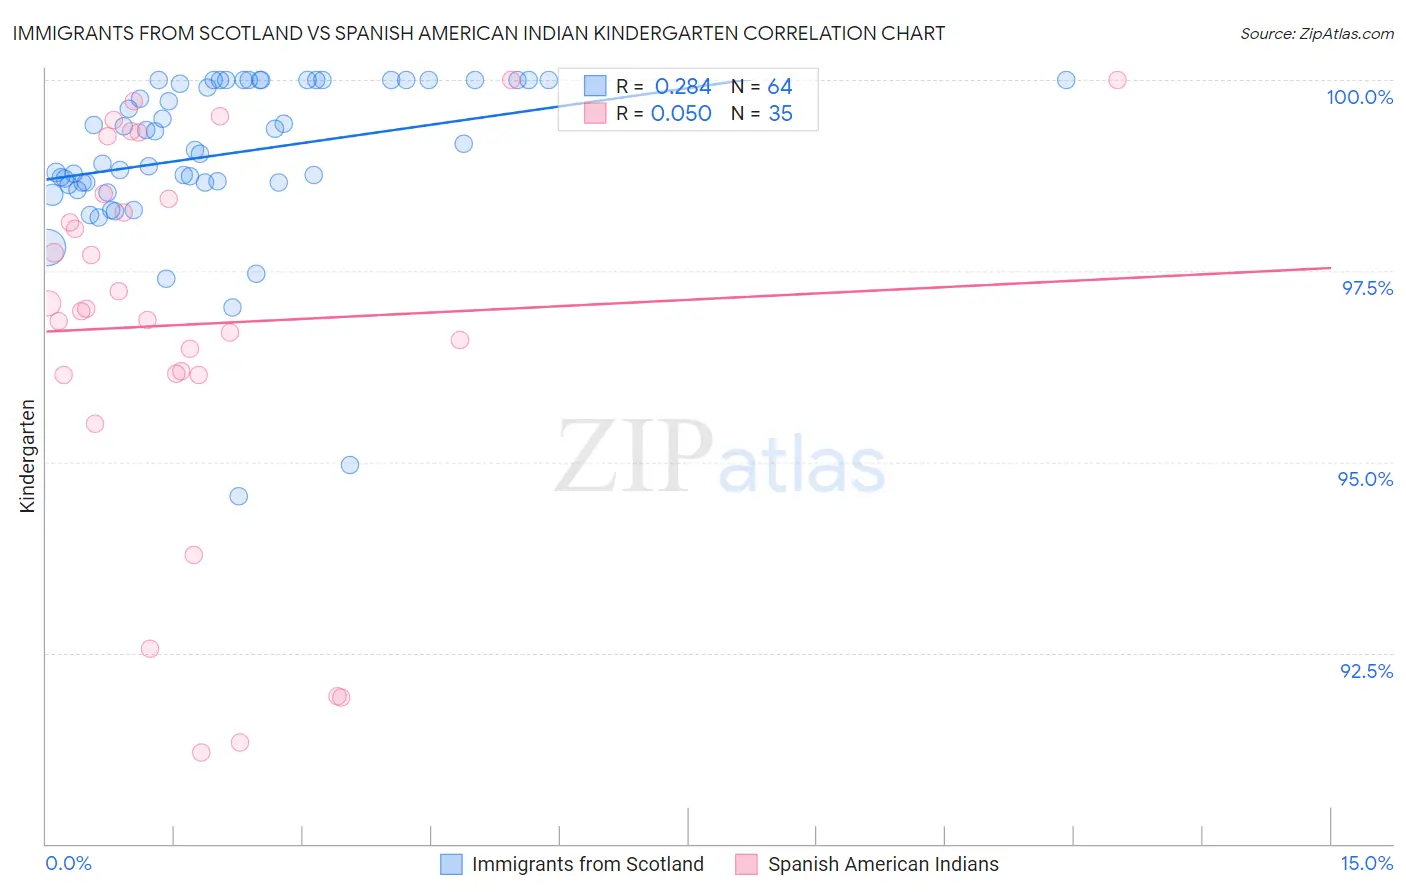
Immigrants from Scotland vs Spanish American Indian Kindergarten Correlation Chart

The statistical analysis conducted on geographies consisting of 196,398,887 people shows a weak positive correlation between the proportion of Immigrants from Scotland and percentage of population with at least kindergarten education in the United States with a correlation coefficient (R) of 0.284 and weighted average of 98.4%. Similarly, the statistical analysis conducted on geographies consisting of 73,150,359 people shows no correlation between the proportion of Spanish American Indians and percentage of population with at least kindergarten education in the United States with a correlation coefficient (R) of 0.050 and weighted average of 95.8%, a difference of 2.7%.
Immigrants from Scotland vs Spanish American Indian Kindergarten

Kindergarten Correlation Summary

MeasurementImmigrants from ScotlandSpanish American Indian
Minimum94.6%91.2%
Maximum100.0%100.0%
Range5.4%8.8%
Mean99.0%96.8%
Median99.1%97.0%
Interquartile 25% (IQ1)98.7%96.1%
Interquartile 75% (IQ3)100.0%98.5%
Interquartile Range (IQR)1.3%2.4%
Standard Deviation (Sample)1.1%2.5%
Standard Deviation (Population)1.1%2.5%

Similar Demographics by Kindergarten

Demographics Similar to Immigrants from Scotland by Kindergarten

In terms of kindergarten, the demographic groups most similar to Immigrants from Scotland are Estonian (98.4%, a difference of 0.010%), Australian (98.4%, a difference of 0.010%), Celtic (98.4%, a difference of 0.010%), Pueblo (98.4%, a difference of 0.010%), and American (98.4%, a difference of 0.010%).
DemographicsRating | RankKindergarten
Ottawa
99.8
/100
|
#48
Exceptional
98.4%
Kiowa
99.8
/100
|
#49
Exceptional
98.4%
Whites/Caucasians
99.8
/100
|
#50
Exceptional
98.4%
Estonians
99.8
/100
|
#51
Exceptional
98.4%
Australians
99.8
/100
|
#52
Exceptional
98.4%
Celtics
99.8
/100
|
#53
Exceptional
98.4%
Pueblo
99.8
/100
|
#54
Exceptional
98.4%
Immigrants | Scotland
99.8
/100
|
#55
Exceptional
98.4%
Americans
99.8
/100
|
#56
Exceptional
98.4%
Austrians
99.8
/100
|
#57
Exceptional
98.4%
Bulgarians
99.7
/100
|
#58
Exceptional
98.4%
Immigrants | Canada
99.7
/100
|
#59
Exceptional
98.4%
Creek
99.7
/100
|
#60
Exceptional
98.4%
Slavs
99.7
/100
|
#61
Exceptional
98.4%
New Zealanders
99.7
/100
|
#62
Exceptional
98.4%

Demographics Similar to Spanish American Indians by Kindergarten

In terms of kindergarten, the demographic groups most similar to Spanish American Indians are Immigrants from Yemen (95.9%, a difference of 0.070%), Immigrants from El Salvador (96.2%, a difference of 0.40%), Nepalese (96.2%, a difference of 0.41%), Salvadoran (96.3%, a difference of 0.56%), and Immigrants from Mexico (96.4%, a difference of 0.59%).
DemographicsRating | RankKindergarten
Central Americans
0.0
/100
|
#333
Tragic
96.6%
Immigrants | Dominican Republic
0.0
/100
|
#334
Tragic
96.6%
Bangladeshis
0.0
/100
|
#335
Tragic
96.6%
Guatemalans
0.0
/100
|
#336
Tragic
96.5%
Immigrants | Cambodia
0.0
/100
|
#337
Tragic
96.5%
Immigrants | Fiji
0.0
/100
|
#338
Tragic
96.5%
Immigrants | Guatemala
0.0
/100
|
#339
Tragic
96.4%
Immigrants | Central America
0.0
/100
|
#340
Tragic
96.4%
Immigrants | Cabo Verde
0.0
/100
|
#341
Tragic
96.4%
Immigrants | Mexico
0.0
/100
|
#342
Tragic
96.4%
Salvadorans
0.0
/100
|
#343
Tragic
96.3%
Nepalese
0.0
/100
|
#344
Tragic
96.2%
Immigrants | El Salvador
0.0
/100
|
#345
Tragic
96.2%
Immigrants | Yemen
0.0
/100
|
#346
Tragic
95.9%
Spanish American Indians
0.0
/100
|
#347
Tragic
95.8%