Immigrants from Russia vs Yugoslavian 10th Grade

COMPARE

Immigrants from Russia
Race
Ancestry
AfghanAfricanAlaska NativeAlaskan AthabascanAlbanianAleutAlsatianAmericanApacheArabArapahoArgentineanArmenianAssyrian/Chaldean/SyriacAustralianAustrianBahamianBangladeshiBarbadianBasqueBelgianBelizeanBermudanBhutaneseBlackfeetBolivianBrazilianBritishBritish West IndianBulgarianBurmeseCajunCambodianCanadianCape VerdeanCarpatho RusynCelticCentral AmericanCentral American IndianCherokeeCheyenneChickasawChileanChineseChippewaChoctawColombianColvilleComancheCosta RicanCreeCreekCroatianCrowCubanCypriotCzechCzechoslovakianDanishDelawareDominicanDutchDutch West IndianEastern EuropeanEcuadorianEgyptianEnglishEstonianEthiopianEuropeanFijianFilipinoFinnishFrenchFrench American IndianFrench CanadianGermanGerman RussianGhanaianGreekGuamanian/ChamorroGuatemalanGuyaneseHaitianHmongHonduranHopiHoumaHungarianIcelanderIndian (Asian)IndonesianInupiatIranianIraqiIrishIroquoisIsraeliItalianJamaicanJapaneseJordanianKenyanKiowaKoreanLaotianLatvianLebaneseLiberianLithuanianLumbeeLuxembourgerMacedonianMalaysianMalteseMarshalleseMenomineeMexicanMexican American IndianMongolianMoroccanNative HawaiianNavajoNepaleseNew ZealanderNicaraguanNigerianNorthern EuropeanNorwegianOkinawanOsageOttawaPaiutePakistaniPalestinianPanamanianParaguayanPennsylvania GermanPeruvianPimaPolishPortuguesePotawatomiPuebloPuerto RicanPuget Sound SalishRomanianRussianSalvadoranSamoanScandinavianScotch-IrishScottishSeminoleSenegaleseSerbianShoshoneSierra LeoneanSiouxSlavicSlovakSloveneSomaliSouth AfricanSouth AmericanSouth American IndianSoviet UnionSpaniardSpanishSpanish AmericanSpanish American IndianSri LankanSubsaharan AfricanSudaneseSwedishSwissSyrianTaiwaneseThaiTlingit-HaidaTohono O'OdhamTonganTrinidadian and TobagonianTsimshianTurkishU.S. Virgin IslanderUgandanUkrainianUruguayanUteVenezuelanVietnameseWelshWest IndianYakamaYaquiYumanYup'ikZimbabwean
Immigration
NonimmigrantsImmigrantsAfghanistanAfricaAlbaniaArgentinaArmeniaAsiaAustraliaAustriaBahamasBangladeshBarbadosBelarusBelgiumBelizeBoliviaBosnia and HerzegovinaBrazilBulgariaBurma/MyanmarCabo VerdeCambodiaCameroonCanadaCaribbeanCentral AmericaChileChinaColombiaCongoCosta RicaCroatiaCubaCzechoslovakiaDenmarkDominicaDominican RepublicEastern AfricaEastern AsiaEastern EuropeEcuadorEgyptEl SalvadorEnglandEritreaEthiopiaEuropeFijiFranceGermanyGhanaGreeceGrenadaGuatemalaGuyanaHaitiHondurasHong KongHungaryIndiaIndonesiaIranIraqIrelandIsraelItalyJamaicaJapanJordanKazakhstanKenyaKoreaKuwaitLaosLatin AmericaLatviaLebanonLiberiaLithuaniaMalaysiaMexicoMicronesiaMiddle AfricaMoldovaMoroccoNepalNetherlandsNicaraguaNigeriaNorth AmericaNorth MacedoniaNorthern AfricaNorthern EuropeNorwayOceaniaPakistanPanamaPeruPhilippinesPolandPortugalRomaniaRussiaSaudi ArabiaScotlandSenegalSerbiaSierra LeoneSingaporeSomaliaSouth AfricaSouth AmericaSouth Central AsiaSouth Eastern AsiaSouthern EuropeSpainSri LankaSt. Vincent and the GrenadinesSudanSwedenSwitzerlandSyriaTaiwanThailandTrinidad and TobagoTurkeyUgandaUkraineUruguayUzbekistanVenezuelaVietnamWest IndiesWestern AfricaWestern AsiaWestern EuropeYemenZaireZimbabweAzores
Yugoslavian
Race
Ancestry
AfghanAfricanAlaska NativeAlaskan AthabascanAlbanianAleutAlsatianAmericanApacheArabArapahoArgentineanArmenianAssyrian/Chaldean/SyriacAustralianAustrianBahamianBangladeshiBarbadianBasqueBelgianBelizeanBermudanBhutaneseBlackfeetBolivianBrazilianBritishBritish West IndianBulgarianBurmeseCajunCambodianCanadianCape VerdeanCarpatho RusynCelticCentral AmericanCentral American IndianCherokeeCheyenneChickasawChileanChineseChippewaChoctawColombianColvilleComancheCosta RicanCreeCreekCroatianCrowCubanCypriotCzechCzechoslovakianDanishDelawareDominicanDutchDutch West IndianEastern EuropeanEcuadorianEgyptianEnglishEstonianEthiopianEuropeanFijianFilipinoFinnishFrenchFrench American IndianFrench CanadianGermanGerman RussianGhanaianGreekGuamanian/ChamorroGuatemalanGuyaneseHaitianHmongHonduranHopiHoumaHungarianIcelanderIndian (Asian)IndonesianInupiatIranianIraqiIrishIroquoisIsraeliItalianJamaicanJapaneseJordanianKenyanKiowaKoreanLaotianLatvianLebaneseLiberianLithuanianLumbeeLuxembourgerMacedonianMalaysianMalteseMarshalleseMenomineeMexicanMexican American IndianMongolianMoroccanNative HawaiianNavajoNepaleseNew ZealanderNicaraguanNigerianNorthern EuropeanNorwegianOkinawanOsageOttawaPaiutePakistaniPalestinianPanamanianParaguayanPennsylvania GermanPeruvianPimaPolishPortuguesePotawatomiPuebloPuerto RicanPuget Sound SalishRomanianRussianSalvadoranSamoanScandinavianScotch-IrishScottishSeminoleSenegaleseSerbianShoshoneSierra LeoneanSiouxSlavicSlovakSloveneSomaliSouth AfricanSouth AmericanSouth American IndianSoviet UnionSpaniardSpanishSpanish AmericanSpanish American IndianSri LankanSubsaharan AfricanSudaneseSwedishSwissSyrianTaiwaneseThaiTlingit-HaidaTohono O'OdhamTonganTrinidadian and TobagonianTsimshianTurkishU.S. Virgin IslanderUgandanUkrainianUruguayanUteVenezuelanVietnameseWelshWest IndianYakamaYaquiYugoslavianYumanYup'ikZimbabwean
Immigration
NonimmigrantsImmigrantsAfghanistanAfricaAlbaniaArgentinaArmeniaAsiaAustraliaAustriaBahamasBangladeshBarbadosBelarusBelgiumBelizeBoliviaBosnia and HerzegovinaBrazilBulgariaBurma/MyanmarCabo VerdeCambodiaCameroonCanadaCaribbeanCentral AmericaChileChinaColombiaCongoCosta RicaCroatiaCubaCzechoslovakiaDenmarkDominicaDominican RepublicEastern AfricaEastern AsiaEastern EuropeEcuadorEgyptEl SalvadorEnglandEritreaEthiopiaEuropeFijiFranceGermanyGhanaGreeceGrenadaGuatemalaGuyanaHaitiHondurasHong KongHungaryIndiaIndonesiaIranIraqIrelandIsraelItalyJamaicaJapanJordanKazakhstanKenyaKoreaKuwaitLaosLatin AmericaLatviaLebanonLiberiaLithuaniaMalaysiaMexicoMicronesiaMiddle AfricaMoldovaMoroccoNepalNetherlandsNicaraguaNigeriaNorth AmericaNorth MacedoniaNorthern AfricaNorthern EuropeNorwayOceaniaPakistanPanamaPeruPhilippinesPolandPortugalRomaniaSaudi ArabiaScotlandSenegalSerbiaSierra LeoneSingaporeSomaliaSouth AfricaSouth AmericaSouth Central AsiaSouth Eastern AsiaSouthern EuropeSpainSri LankaSt. Vincent and the GrenadinesSudanSwedenSwitzerlandSyriaTaiwanThailandTrinidad and TobagoTurkeyUgandaUkraineUruguayUzbekistanVenezuelaVietnamWest IndiesWestern AfricaWestern AsiaWestern EuropeYemenZaireZimbabweAzores
10th Grade
Income
Poverty
Unemployment
Labor Participation
Family Structure
Vehicle Availability
Education Level
Disability

10th Grade Comparison

Immigrants from Russia

Yugoslavians

Exceptional
Exceptional
94.3%
10TH GRADE
92.4/ 100
METRIC RATING
132nd/ 347
METRIC RANK
94.6%
10TH GRADE
98.4/ 100
METRIC RATING
92nd/ 347
METRIC RANK

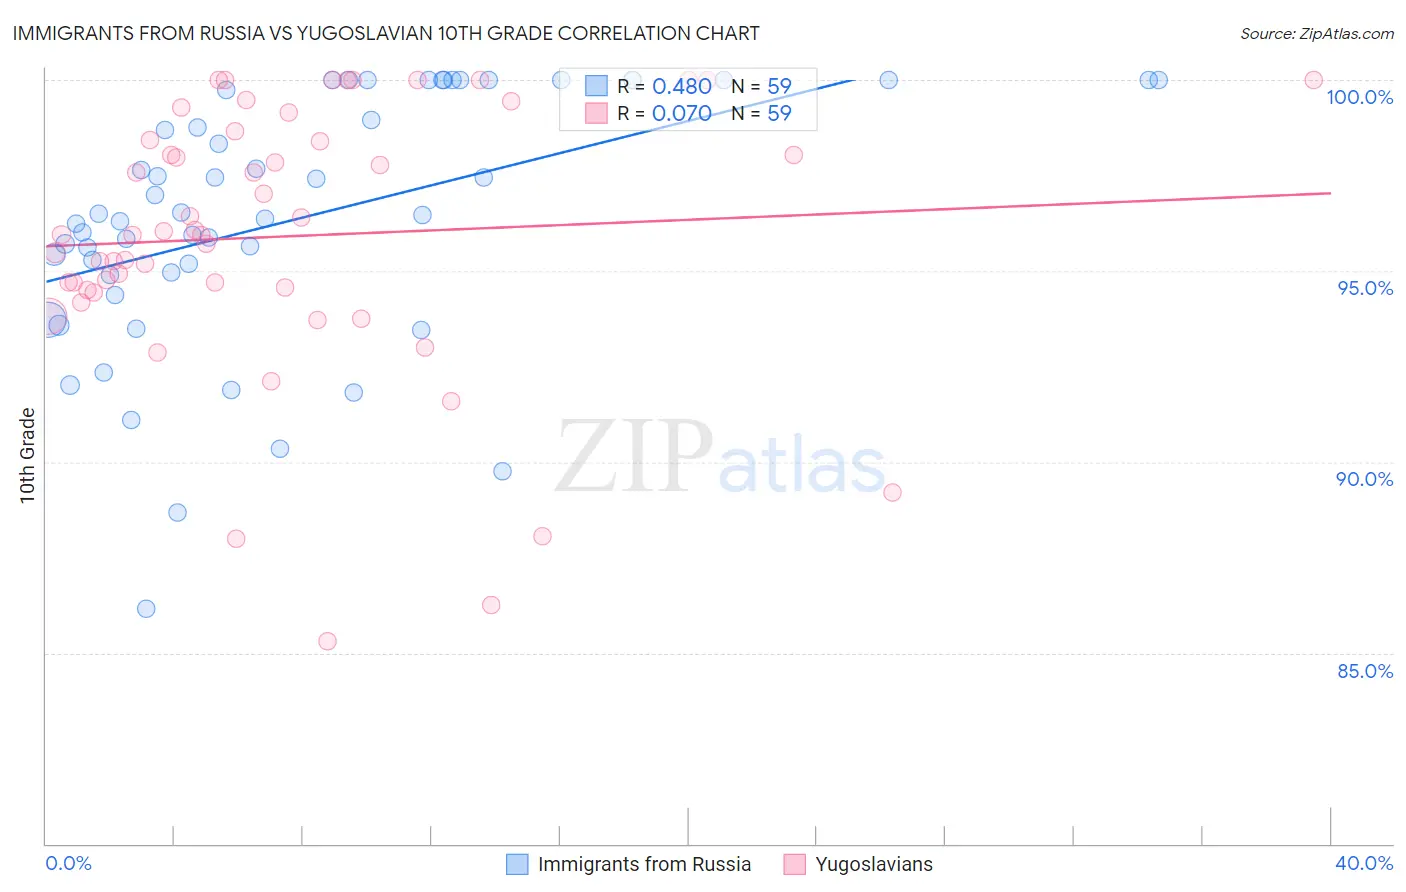
Immigrants from Russia vs Yugoslavian 10th Grade Correlation Chart

The statistical analysis conducted on geographies consisting of 347,948,494 people shows a moderate positive correlation between the proportion of Immigrants from Russia and percentage of population with at least 10th grade education in the United States with a correlation coefficient (R) of 0.480 and weighted average of 94.3%. Similarly, the statistical analysis conducted on geographies consisting of 285,719,638 people shows a slight positive correlation between the proportion of Yugoslavians and percentage of population with at least 10th grade education in the United States with a correlation coefficient (R) of 0.070 and weighted average of 94.6%, a difference of 0.36%.
Immigrants from Russia vs Yugoslavian 10th Grade

10th Grade Correlation Summary

MeasurementImmigrants from RussiaYugoslavian
Minimum86.2%85.3%
Maximum100.0%100.0%
Range13.8%14.7%
Mean96.3%95.9%
Median96.5%95.9%
Interquartile 25% (IQ1)94.9%94.5%
Interquartile 75% (IQ3)100.0%98.7%
Interquartile Range (IQR)5.1%4.1%
Standard Deviation (Sample)3.3%3.5%
Standard Deviation (Population)3.3%3.5%

Similar Demographics by 10th Grade

Demographics Similar to Immigrants from Russia by 10th Grade

In terms of 10th grade, the demographic groups most similar to Immigrants from Russia are Iroquois (94.3%, a difference of 0.010%), Immigrants from Greece (94.3%, a difference of 0.010%), Immigrants from Eastern Europe (94.3%, a difference of 0.010%), Creek (94.2%, a difference of 0.010%), and Osage (94.2%, a difference of 0.020%).
DemographicsRating | Rank10th Grade
Americans
94.4
/100
|
#125
Exceptional
94.3%
Immigrants | Iran
94.4
/100
|
#126
Exceptional
94.3%
Israelis
93.8
/100
|
#127
Exceptional
94.3%
Potawatomi
93.6
/100
|
#128
Exceptional
94.3%
Iroquois
92.8
/100
|
#129
Exceptional
94.3%
Immigrants | Greece
92.7
/100
|
#130
Exceptional
94.3%
Immigrants | Eastern Europe
92.5
/100
|
#131
Exceptional
94.3%
Immigrants | Russia
92.4
/100
|
#132
Exceptional
94.3%
Creek
91.9
/100
|
#133
Exceptional
94.2%
Osage
91.7
/100
|
#134
Exceptional
94.2%
Immigrants | Korea
91.3
/100
|
#135
Exceptional
94.2%
Shoshone
90.8
/100
|
#136
Exceptional
94.2%
Arapaho
90.5
/100
|
#137
Exceptional
94.2%
Immigrants | Sri Lanka
89.9
/100
|
#138
Excellent
94.2%
Immigrants | Bosnia and Herzegovina
89.4
/100
|
#139
Excellent
94.2%

Demographics Similar to Yugoslavians by 10th Grade

In terms of 10th grade, the demographic groups most similar to Yugoslavians are Soviet Union (94.6%, a difference of 0.010%), Immigrants from Germany (94.6%, a difference of 0.010%), Menominee (94.6%, a difference of 0.010%), Immigrants from Switzerland (94.6%, a difference of 0.020%), and Lebanese (94.6%, a difference of 0.020%).
DemographicsRating | Rank10th Grade
Crow
99.0
/100
|
#85
Exceptional
94.7%
Puget Sound Salish
99.0
/100
|
#86
Exceptional
94.7%
Immigrants | Saudi Arabia
99.0
/100
|
#87
Exceptional
94.7%
Immigrants | Japan
99.0
/100
|
#88
Exceptional
94.7%
Immigrants | Moldova
98.9
/100
|
#89
Exceptional
94.7%
South Africans
98.8
/100
|
#90
Exceptional
94.7%
Whites/Caucasians
98.8
/100
|
#91
Exceptional
94.7%
Yugoslavians
98.4
/100
|
#92
Exceptional
94.6%
Soviet Union
98.3
/100
|
#93
Exceptional
94.6%
Immigrants | Germany
98.3
/100
|
#94
Exceptional
94.6%
Menominee
98.3
/100
|
#95
Exceptional
94.6%
Immigrants | Switzerland
98.3
/100
|
#96
Exceptional
94.6%
Lebanese
98.3
/100
|
#97
Exceptional
94.6%
Immigrants | Bulgaria
98.1
/100
|
#98
Exceptional
94.6%
Immigrants | France
97.9
/100
|
#99
Exceptional
94.5%