Immigrants from Portugal vs Chippewa 8th Grade
COMPARE
Immigrants from Portugal
Chippewa
8th Grade
8th Grade Comparison
Immigrants from Portugal
Chippewa
93.8%
8TH GRADE
0.0/ 100
METRIC RATING
307th/ 347
METRIC RANK
97.1%
8TH GRADE
100.0/ 100
METRIC RATING
31st/ 347
METRIC RANK
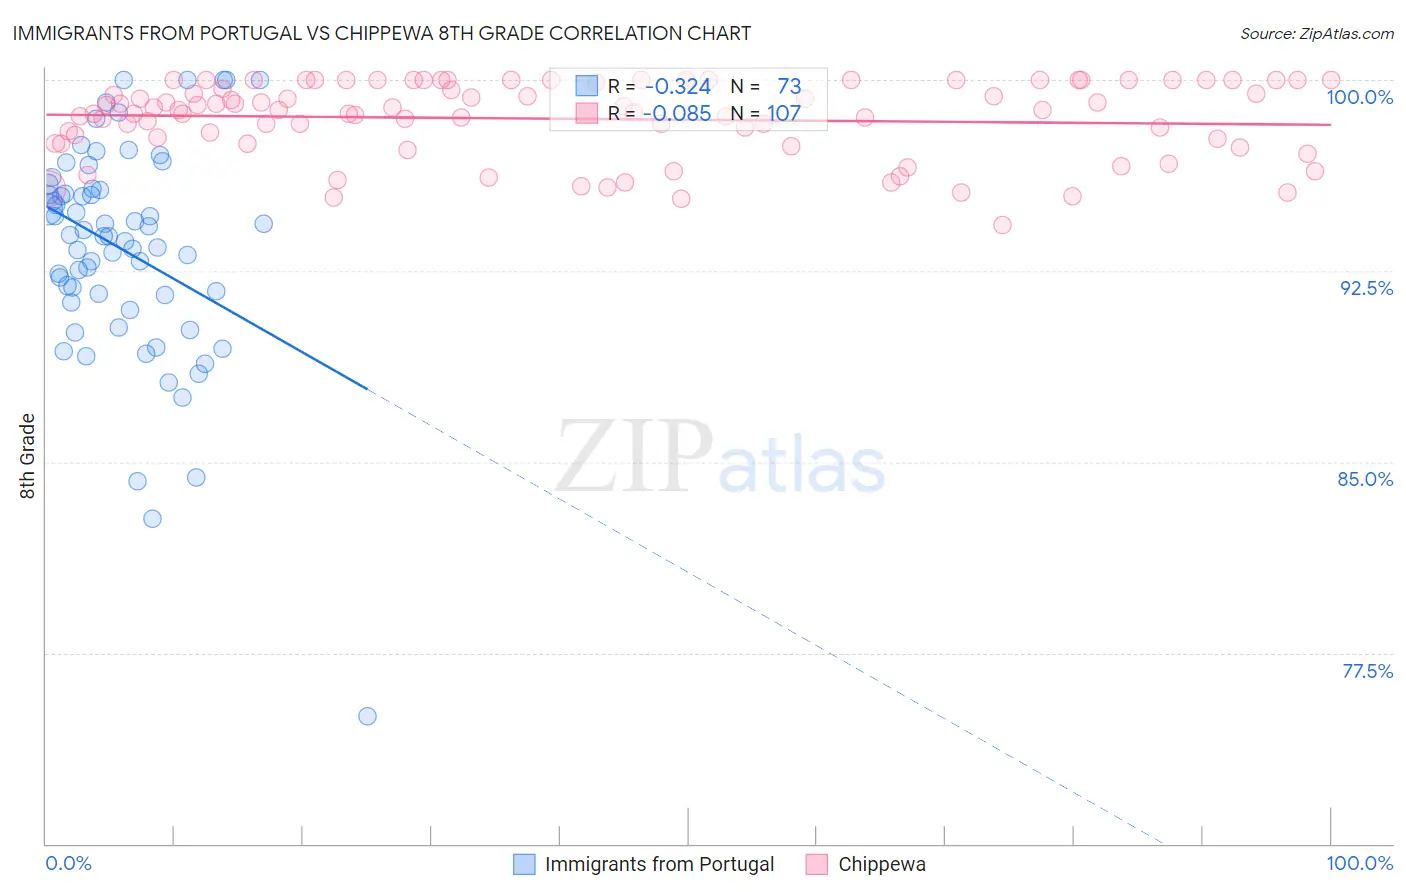
Immigrants from Portugal vs Chippewa 8th Grade Correlation Chart
The statistical analysis conducted on geographies consisting of 174,792,107 people shows a mild negative correlation between the proportion of Immigrants from Portugal and percentage of population with at least 8th grade education in the United States with a correlation coefficient (R) of -0.324 and weighted average of 93.8%. Similarly, the statistical analysis conducted on geographies consisting of 215,065,863 people shows a slight negative correlation between the proportion of Chippewa and percentage of population with at least 8th grade education in the United States with a correlation coefficient (R) of -0.085 and weighted average of 97.1%, a difference of 3.5%.
8th Grade Correlation Summary
| Measurement | Immigrants from Portugal | Chippewa |
| Minimum | 75.0% | 94.3% |
| Maximum | 100.0% | 100.0% |
| Range | 25.0% | 5.7% |
| Mean | 93.3% | 98.5% |
| Median | 93.8% | 98.8% |
| Interquartile 25% (IQ1) | 91.4% | 97.5% |
| Interquartile 75% (IQ3) | 95.7% | 100.0% |
| Interquartile Range (IQR) | 4.3% | 2.5% |
| Standard Deviation (Sample) | 4.3% | 1.5% |
| Standard Deviation (Population) | 4.3% | 1.5% |
Similar Demographics by 8th Grade
Demographics Similar to Immigrants from Portugal by 8th Grade
In terms of 8th grade, the demographic groups most similar to Immigrants from Portugal are Immigrants from Guyana (93.8%, a difference of 0.010%), Immigrants from Haiti (93.9%, a difference of 0.11%), Guyanese (93.9%, a difference of 0.14%), Ecuadorian (93.6%, a difference of 0.17%), and Immigrants (93.6%, a difference of 0.19%).
| Demographics | Rating | Rank | 8th Grade |
| Immigrants | Burma/Myanmar | 0.0 /100 | #300 | Tragic 94.1% |
| Immigrants | Laos | 0.0 /100 | #301 | Tragic 94.1% |
| Sri Lankans | 0.0 /100 | #302 | Tragic 94.0% |
| Immigrants | Dominica | 0.0 /100 | #303 | Tragic 94.0% |
| Guyanese | 0.0 /100 | #304 | Tragic 93.9% |
| Immigrants | Haiti | 0.0 /100 | #305 | Tragic 93.9% |
| Immigrants | Guyana | 0.0 /100 | #306 | Tragic 93.8% |
| Immigrants | Portugal | 0.0 /100 | #307 | Tragic 93.8% |
| Ecuadorians | 0.0 /100 | #308 | Tragic 93.6% |
| Immigrants | Immigrants | 0.0 /100 | #309 | Tragic 93.6% |
| Japanese | 0.0 /100 | #310 | Tragic 93.6% |
| Immigrants | Bangladesh | 0.0 /100 | #311 | Tragic 93.6% |
| Cape Verdeans | 0.0 /100 | #312 | Tragic 93.5% |
| Immigrants | Caribbean | 0.0 /100 | #313 | Tragic 93.5% |
| Immigrants | Vietnam | 0.0 /100 | #314 | Tragic 93.5% |
Demographics Similar to Chippewa by 8th Grade
In terms of 8th grade, the demographic groups most similar to Chippewa are Sioux (97.1%, a difference of 0.0%), Italian (97.1%, a difference of 0.030%), European (97.1%, a difference of 0.030%), Yup'ik (97.0%, a difference of 0.030%), and Swiss (97.0%, a difference of 0.040%).
| Demographics | Rating | Rank | 8th Grade |
| Scandinavians | 100.0 /100 | #24 | Exceptional 97.2% |
| Czechs | 100.0 /100 | #25 | Exceptional 97.1% |
| French | 100.0 /100 | #26 | Exceptional 97.1% |
| Scotch-Irish | 100.0 /100 | #27 | Exceptional 97.1% |
| Italians | 100.0 /100 | #28 | Exceptional 97.1% |
| Europeans | 100.0 /100 | #29 | Exceptional 97.1% |
| Sioux | 100.0 /100 | #30 | Exceptional 97.1% |
| Chippewa | 100.0 /100 | #31 | Exceptional 97.1% |
| Yup'ik | 100.0 /100 | #32 | Exceptional 97.0% |
| Swiss | 100.0 /100 | #33 | Exceptional 97.0% |
| Luxembourgers | 100.0 /100 | #34 | Exceptional 97.0% |
| Alaska Natives | 100.0 /100 | #35 | Exceptional 97.0% |
| Belgians | 100.0 /100 | #36 | Exceptional 97.0% |
| Latvians | 100.0 /100 | #37 | Exceptional 97.0% |
| British | 100.0 /100 | #38 | Exceptional 97.0% |