Immigrants from Northern Europe vs Laotian 2nd Grade

COMPARE

Immigrants from Northern Europe
Race
Ancestry
AfghanAfricanAlaska NativeAlaskan AthabascanAlbanianAleutAlsatianAmericanApacheArabArapahoArgentineanArmenianAssyrian/Chaldean/SyriacAustralianAustrianBahamianBangladeshiBarbadianBasqueBelgianBelizeanBermudanBhutaneseBlackfeetBolivianBrazilianBritishBritish West IndianBulgarianBurmeseCajunCambodianCanadianCape VerdeanCarpatho RusynCelticCentral AmericanCentral American IndianCherokeeCheyenneChickasawChileanChineseChippewaChoctawColombianColvilleComancheCosta RicanCreeCreekCroatianCrowCubanCypriotCzechCzechoslovakianDanishDelawareDominicanDutchDutch West IndianEastern EuropeanEcuadorianEgyptianEnglishEstonianEthiopianEuropeanFijianFilipinoFinnishFrenchFrench American IndianFrench CanadianGermanGerman RussianGhanaianGreekGuamanian/ChamorroGuatemalanGuyaneseHaitianHmongHonduranHopiHoumaHungarianIcelanderIndian (Asian)IndonesianInupiatIranianIraqiIrishIroquoisIsraeliItalianJamaicanJapaneseJordanianKenyanKiowaKoreanLatvianLebaneseLiberianLithuanianLumbeeLuxembourgerMacedonianMalaysianMalteseMarshalleseMenomineeMexicanMexican American IndianMongolianMoroccanNative HawaiianNavajoNepaleseNew ZealanderNicaraguanNigerianNorthern EuropeanNorwegianOkinawanOsageOttawaPaiutePakistaniPalestinianPanamanianParaguayanPennsylvania GermanPeruvianPimaPolishPortuguesePotawatomiPuebloPuerto RicanPuget Sound SalishRomanianRussianSalvadoranSamoanScandinavianScotch-IrishScottishSeminoleSenegaleseSerbianShoshoneSierra LeoneanSiouxSlavicSlovakSloveneSomaliSouth AfricanSouth AmericanSouth American IndianSoviet UnionSpaniardSpanishSpanish AmericanSpanish American IndianSri LankanSubsaharan AfricanSudaneseSwedishSwissSyrianTaiwaneseThaiTlingit-HaidaTohono O'OdhamTonganTrinidadian and TobagonianTsimshianTurkishU.S. Virgin IslanderUgandanUkrainianUruguayanUteVenezuelanVietnameseWelshWest IndianYakamaYaquiYugoslavianYumanYup'ikZimbabwean
Immigration
NonimmigrantsImmigrantsAfghanistanAfricaAlbaniaArgentinaArmeniaAsiaAustraliaAustriaBahamasBangladeshBarbadosBelarusBelgiumBelizeBoliviaBosnia and HerzegovinaBrazilBulgariaBurma/MyanmarCabo VerdeCambodiaCameroonCanadaCaribbeanCentral AmericaChileChinaColombiaCongoCosta RicaCroatiaCubaCzechoslovakiaDenmarkDominicaDominican RepublicEastern AfricaEastern AsiaEastern EuropeEcuadorEgyptEl SalvadorEnglandEritreaEthiopiaEuropeFijiFranceGermanyGhanaGreeceGrenadaGuatemalaGuyanaHaitiHondurasHong KongHungaryIndiaIndonesiaIranIraqIrelandIsraelItalyJamaicaJapanJordanKazakhstanKenyaKoreaKuwaitLaosLatin AmericaLatviaLebanonLiberiaLithuaniaMalaysiaMexicoMicronesiaMiddle AfricaMoldovaMoroccoNepalNetherlandsNicaraguaNigeriaNorth AmericaNorth MacedoniaNorthern AfricaNorthern EuropeNorwayOceaniaPakistanPanamaPeruPhilippinesPolandPortugalRomaniaRussiaSaudi ArabiaScotlandSenegalSerbiaSierra LeoneSingaporeSomaliaSouth AfricaSouth AmericaSouth Central AsiaSouth Eastern AsiaSouthern EuropeSpainSri LankaSt. Vincent and the GrenadinesSudanSwedenSwitzerlandSyriaTaiwanThailandTrinidad and TobagoTurkeyUgandaUkraineUruguayUzbekistanVenezuelaVietnamWest IndiesWestern AfricaWestern AsiaWestern EuropeYemenZaireZimbabweAzores
Laotian
Race
Ancestry
AfghanAfricanAlaska NativeAlaskan AthabascanAlbanianAleutAlsatianAmericanApacheArabArapahoArgentineanArmenianAssyrian/Chaldean/SyriacAustralianAustrianBahamianBangladeshiBarbadianBasqueBelgianBelizeanBermudanBhutaneseBlackfeetBolivianBrazilianBritishBritish West IndianBulgarianBurmeseCajunCambodianCanadianCape VerdeanCarpatho RusynCelticCentral AmericanCentral American IndianCherokeeCheyenneChickasawChileanChineseChippewaChoctawColombianColvilleComancheCosta RicanCreeCreekCroatianCrowCubanCypriotCzechCzechoslovakianDanishDelawareDominicanDutchDutch West IndianEastern EuropeanEcuadorianEgyptianEnglishEstonianEthiopianEuropeanFijianFilipinoFinnishFrenchFrench American IndianFrench CanadianGermanGerman RussianGhanaianGreekGuamanian/ChamorroGuatemalanGuyaneseHaitianHmongHonduranHopiHoumaHungarianIcelanderIndian (Asian)IndonesianInupiatIranianIraqiIrishIroquoisIsraeliItalianJamaicanJapaneseJordanianKenyanKiowaKoreanLaotianLatvianLebaneseLiberianLithuanianLumbeeLuxembourgerMacedonianMalaysianMalteseMarshalleseMenomineeMexicanMexican American IndianMongolianMoroccanNative HawaiianNavajoNepaleseNew ZealanderNicaraguanNigerianNorthern EuropeanNorwegianOkinawanOsageOttawaPaiutePakistaniPalestinianPanamanianParaguayanPennsylvania GermanPeruvianPimaPolishPortuguesePotawatomiPuebloPuerto RicanPuget Sound SalishRomanianRussianSalvadoranSamoanScandinavianScotch-IrishScottishSeminoleSenegaleseSerbianShoshoneSierra LeoneanSiouxSlavicSlovakSloveneSomaliSouth AfricanSouth AmericanSouth American IndianSoviet UnionSpaniardSpanishSpanish AmericanSpanish American IndianSri LankanSubsaharan AfricanSudaneseSwedishSwissSyrianTaiwaneseThaiTlingit-HaidaTohono O'OdhamTonganTrinidadian and TobagonianTsimshianTurkishU.S. Virgin IslanderUgandanUkrainianUruguayanUteVenezuelanVietnameseWelshWest IndianYakamaYaquiYugoslavianYumanYup'ikZimbabwean
Immigration
NonimmigrantsImmigrantsAfghanistanAfricaAlbaniaArgentinaArmeniaAsiaAustraliaAustriaBahamasBangladeshBarbadosBelarusBelgiumBelizeBoliviaBosnia and HerzegovinaBrazilBulgariaBurma/MyanmarCabo VerdeCambodiaCameroonCanadaCaribbeanCentral AmericaChileChinaColombiaCongoCosta RicaCroatiaCubaCzechoslovakiaDenmarkDominicaDominican RepublicEastern AfricaEastern AsiaEastern EuropeEcuadorEgyptEl SalvadorEnglandEritreaEthiopiaEuropeFijiFranceGermanyGhanaGreeceGrenadaGuatemalaGuyanaHaitiHondurasHong KongHungaryIndiaIndonesiaIranIraqIrelandIsraelItalyJamaicaJapanJordanKazakhstanKenyaKoreaKuwaitLaosLatin AmericaLatviaLebanonLiberiaLithuaniaMalaysiaMexicoMicronesiaMiddle AfricaMoldovaMoroccoNepalNetherlandsNicaraguaNigeriaNorth AmericaNorth MacedoniaNorthern AfricaNorwayOceaniaPakistanPanamaPeruPhilippinesPolandPortugalRomaniaRussiaSaudi ArabiaScotlandSenegalSerbiaSierra LeoneSingaporeSomaliaSouth AfricaSouth AmericaSouth Central AsiaSouth Eastern AsiaSouthern EuropeSpainSri LankaSt. Vincent and the GrenadinesSudanSwedenSwitzerlandSyriaTaiwanThailandTrinidad and TobagoTurkeyUgandaUkraineUruguayUzbekistanVenezuelaVietnamWest IndiesWestern AfricaWestern AsiaWestern EuropeYemenZaireZimbabweAzores
2nd Grade
Income
Poverty
Unemployment
Labor Participation
Family Structure
Vehicle Availability
Education Level
Disability

2nd Grade Comparison

Immigrants from Northern Europe

Laotians

Exceptional
Tragic
98.3%
2ND GRADE
99.7/ 100
METRIC RATING
67th/ 347
METRIC RANK
97.7%
2ND GRADE
9.9/ 100
METRIC RATING
211th/ 347
METRIC RANK

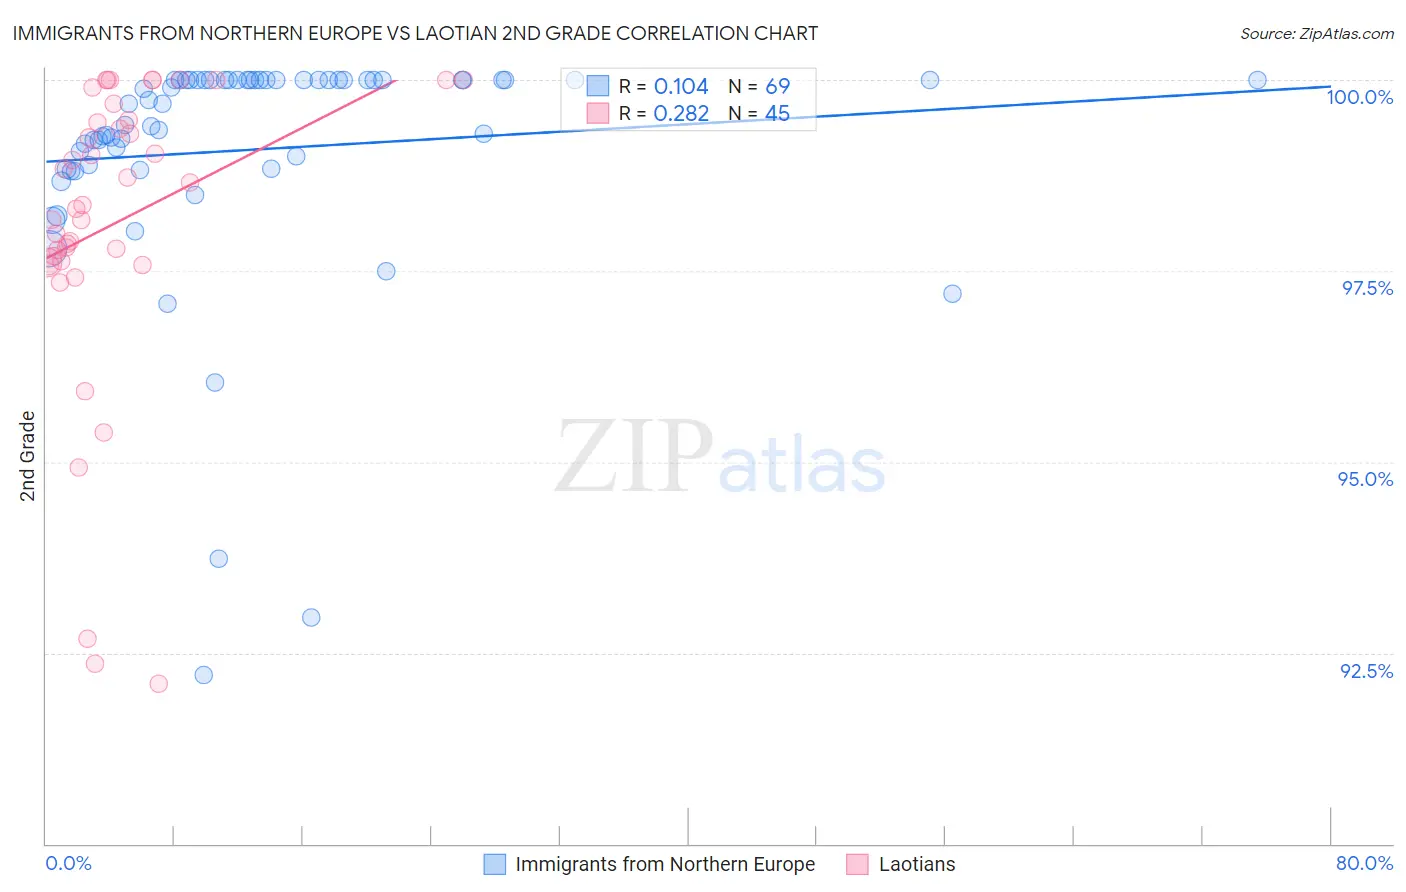
Immigrants from Northern Europe vs Laotian 2nd Grade Correlation Chart

The statistical analysis conducted on geographies consisting of 477,226,800 people shows a poor positive correlation between the proportion of Immigrants from Northern Europe and percentage of population with at least 2nd grade education in the United States with a correlation coefficient (R) of 0.104 and weighted average of 98.3%. Similarly, the statistical analysis conducted on geographies consisting of 224,863,064 people shows a weak positive correlation between the proportion of Laotians and percentage of population with at least 2nd grade education in the United States with a correlation coefficient (R) of 0.282 and weighted average of 97.7%, a difference of 0.62%.
Immigrants from Northern Europe vs Laotian 2nd Grade

2nd Grade Correlation Summary

MeasurementImmigrants from Northern EuropeLaotian
Minimum92.2%92.1%
Maximum100.0%100.0%
Range7.8%7.9%
Mean99.1%98.1%
Median99.7%98.4%
Interquartile 25% (IQ1)98.8%97.6%
Interquartile 75% (IQ3)100.0%99.6%
Interquartile Range (IQR)1.2%2.0%
Standard Deviation (Sample)1.6%2.0%
Standard Deviation (Population)1.6%2.0%

Similar Demographics by 2nd Grade

Demographics Similar to Immigrants from Northern Europe by 2nd Grade

In terms of 2nd grade, the demographic groups most similar to Immigrants from Northern Europe are Canadian (98.3%, a difference of 0.0%), Russian (98.3%, a difference of 0.0%), Immigrants from Austria (98.3%, a difference of 0.0%), Serbian (98.3%, a difference of 0.0%), and Chickasaw (98.3%, a difference of 0.010%).
DemographicsRating | Rank2nd Grade
Creek
99.8
/100
|
#60
Exceptional
98.3%
Immigrants | Canada
99.8
/100
|
#61
Exceptional
98.3%
Greeks
99.8
/100
|
#62
Exceptional
98.3%
Maltese
99.7
/100
|
#63
Exceptional
98.3%
Immigrants | North America
99.7
/100
|
#64
Exceptional
98.3%
New Zealanders
99.7
/100
|
#65
Exceptional
98.3%
Canadians
99.7
/100
|
#66
Exceptional
98.3%
Immigrants | Northern Europe
99.7
/100
|
#67
Exceptional
98.3%
Russians
99.7
/100
|
#68
Exceptional
98.3%
Immigrants | Austria
99.6
/100
|
#69
Exceptional
98.3%
Serbians
99.6
/100
|
#70
Exceptional
98.3%
Chickasaw
99.6
/100
|
#71
Exceptional
98.3%
Cheyenne
99.6
/100
|
#72
Exceptional
98.3%
Cajuns
99.5
/100
|
#73
Exceptional
98.3%
Immigrants | Netherlands
99.4
/100
|
#74
Exceptional
98.3%

Demographics Similar to Laotians by 2nd Grade

In terms of 2nd grade, the demographic groups most similar to Laotians are Costa Rican (97.7%, a difference of 0.0%), Immigrants from Oceania (97.7%, a difference of 0.010%), Immigrants from Bahamas (97.7%, a difference of 0.010%), Immigrants from Northern Africa (97.7%, a difference of 0.020%), and Moroccan (97.7%, a difference of 0.020%).
DemographicsRating | Rank2nd Grade
Immigrants | Albania
18.4
/100
|
#204
Poor
97.8%
Immigrants | Southern Europe
18.1
/100
|
#205
Poor
97.8%
Immigrants | Chile
17.3
/100
|
#206
Poor
97.7%
Africans
15.6
/100
|
#207
Poor
97.7%
Immigrants | Northern Africa
12.3
/100
|
#208
Poor
97.7%
Immigrants | Oceania
10.9
/100
|
#209
Poor
97.7%
Costa Ricans
10.5
/100
|
#210
Poor
97.7%
Laotians
9.9
/100
|
#211
Tragic
97.7%
Immigrants | Bahamas
8.4
/100
|
#212
Tragic
97.7%
Moroccans
8.2
/100
|
#213
Tragic
97.7%
Samoans
7.1
/100
|
#214
Tragic
97.7%
Bahamians
6.8
/100
|
#215
Tragic
97.7%
South American Indians
6.7
/100
|
#216
Tragic
97.7%
Uruguayans
6.2
/100
|
#217
Tragic
97.7%
Sudanese
5.7
/100
|
#218
Tragic
97.7%