Immigrants from Northern Africa vs Immigrants from Cabo Verde College, Under 1 year
COMPARE
Immigrants from Northern Africa
Immigrants from Cabo Verde
College, Under 1 year
College, Under 1 year Comparison
Immigrants from Northern Africa
Immigrants from Cabo Verde
67.2%
COLLEGE, UNDER 1 YEAR
92.7/ 100
METRIC RATING
123rd/ 347
METRIC RANK
53.7%
COLLEGE, UNDER 1 YEAR
0.0/ 100
METRIC RATING
341st/ 347
METRIC RANK
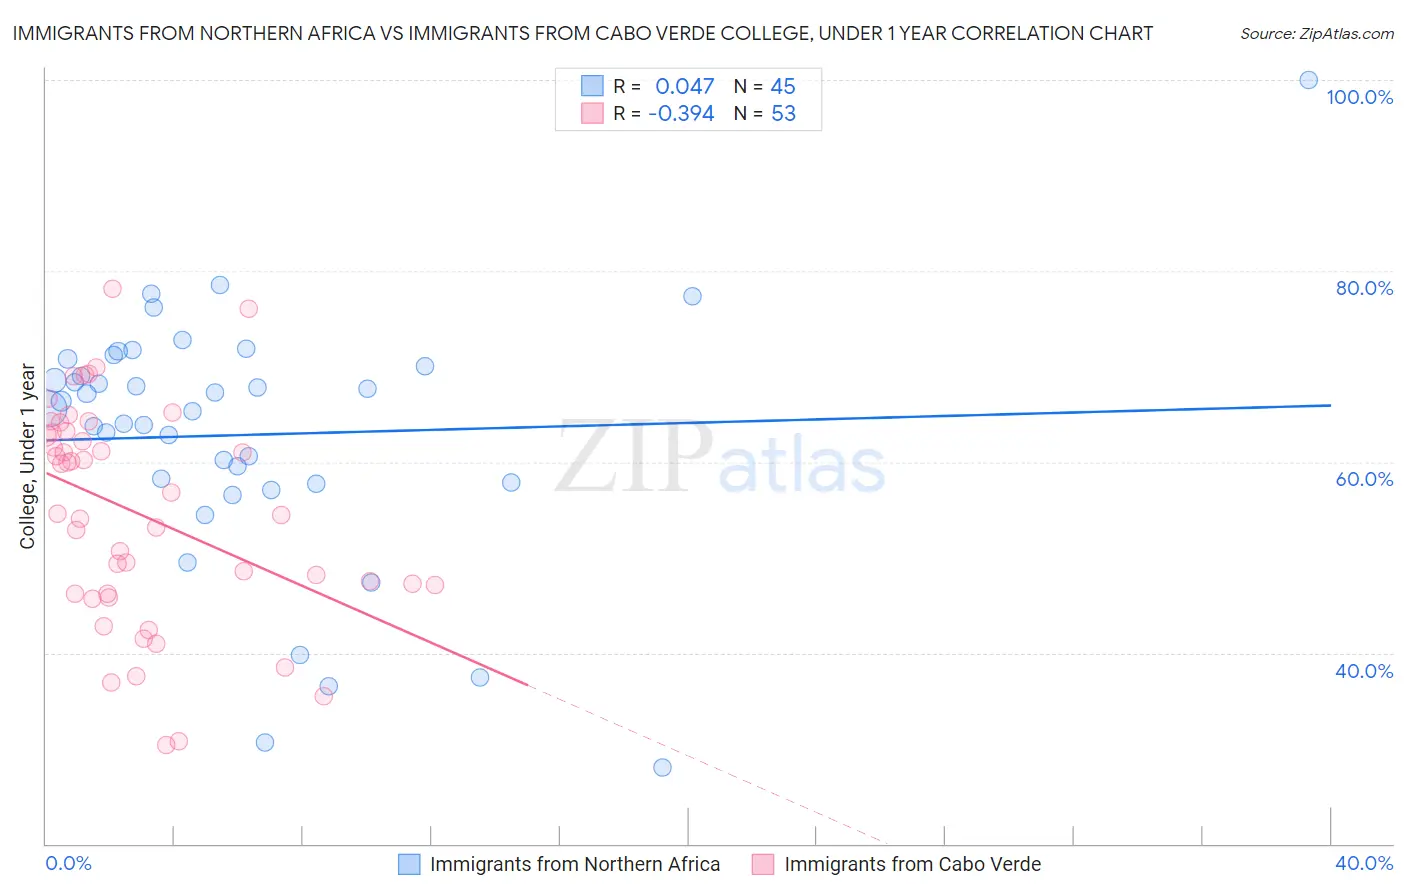
Immigrants from Northern Africa vs Immigrants from Cabo Verde College, Under 1 year Correlation Chart
The statistical analysis conducted on geographies consisting of 321,198,131 people shows no correlation between the proportion of Immigrants from Northern Africa and percentage of population with at least college, under 1 year education in the United States with a correlation coefficient (R) of 0.047 and weighted average of 67.2%. Similarly, the statistical analysis conducted on geographies consisting of 38,158,666 people shows a mild negative correlation between the proportion of Immigrants from Cabo Verde and percentage of population with at least college, under 1 year education in the United States with a correlation coefficient (R) of -0.394 and weighted average of 53.7%, a difference of 25.3%.
College, Under 1 year Correlation Summary
| Measurement | Immigrants from Northern Africa | Immigrants from Cabo Verde |
| Minimum | 28.0% | 30.4% |
| Maximum | 100.0% | 78.2% |
| Range | 72.0% | 47.8% |
| Mean | 62.8% | 54.6% |
| Median | 65.6% | 54.6% |
| Interquartile 25% (IQ1) | 57.7% | 46.2% |
| Interquartile 75% (IQ3) | 70.4% | 63.1% |
| Interquartile Range (IQR) | 12.7% | 16.9% |
| Standard Deviation (Sample) | 13.3% | 11.4% |
| Standard Deviation (Population) | 13.2% | 11.3% |
Similar Demographics by College, Under 1 year
Demographics Similar to Immigrants from Northern Africa by College, Under 1 year
In terms of college, under 1 year, the demographic groups most similar to Immigrants from Northern Africa are Arab (67.2%, a difference of 0.010%), Immigrants from Jordan (67.3%, a difference of 0.020%), Slovene (67.3%, a difference of 0.11%), Italian (67.2%, a difference of 0.13%), and Alsatian (67.1%, a difference of 0.19%).
| Demographics | Rating | Rank | College, Under 1 year |
| Immigrants | Nepal | 94.9 /100 | #116 | Exceptional 67.5% |
| Pakistanis | 94.8 /100 | #117 | Exceptional 67.5% |
| Immigrants | Ukraine | 94.7 /100 | #118 | Exceptional 67.5% |
| Lebanese | 94.6 /100 | #119 | Exceptional 67.5% |
| Serbians | 93.9 /100 | #120 | Exceptional 67.4% |
| Slovenes | 93.3 /100 | #121 | Exceptional 67.3% |
| Immigrants | Jordan | 92.8 /100 | #122 | Exceptional 67.3% |
| Immigrants | Northern Africa | 92.7 /100 | #123 | Exceptional 67.2% |
| Arabs | 92.6 /100 | #124 | Exceptional 67.2% |
| Italians | 91.8 /100 | #125 | Exceptional 67.2% |
| Alsatians | 91.3 /100 | #126 | Exceptional 67.1% |
| Czechs | 90.8 /100 | #127 | Exceptional 67.1% |
| Scottish | 90.2 /100 | #128 | Exceptional 67.0% |
| Immigrants | Eastern Africa | 89.5 /100 | #129 | Excellent 67.0% |
| Immigrants | Syria | 89.0 /100 | #130 | Excellent 66.9% |
Demographics Similar to Immigrants from Cabo Verde by College, Under 1 year
In terms of college, under 1 year, the demographic groups most similar to Immigrants from Cabo Verde are Immigrants from Mexico (53.7%, a difference of 0.060%), Spanish American Indian (54.0%, a difference of 0.51%), Immigrants from Dominican Republic (54.0%, a difference of 0.59%), Lumbee (54.2%, a difference of 1.0%), and Immigrants from Central America (54.4%, a difference of 1.4%).
| Demographics | Rating | Rank | College, Under 1 year |
| Yuman | 0.0 /100 | #333 | Tragic 55.1% |
| Immigrants | Azores | 0.0 /100 | #334 | Tragic 54.7% |
| Inupiat | 0.0 /100 | #335 | Tragic 54.6% |
| Pennsylvania Germans | 0.0 /100 | #336 | Tragic 54.5% |
| Immigrants | Central America | 0.0 /100 | #337 | Tragic 54.4% |
| Lumbee | 0.0 /100 | #338 | Tragic 54.2% |
| Immigrants | Dominican Republic | 0.0 /100 | #339 | Tragic 54.0% |
| Spanish American Indians | 0.0 /100 | #340 | Tragic 54.0% |
| Immigrants | Cabo Verde | 0.0 /100 | #341 | Tragic 53.7% |
| Immigrants | Mexico | 0.0 /100 | #342 | Tragic 53.7% |
| Tohono O'odham | 0.0 /100 | #343 | Tragic 52.8% |
| Yakama | 0.0 /100 | #344 | Tragic 52.6% |
| Pima | 0.0 /100 | #345 | Tragic 51.4% |
| Houma | 0.0 /100 | #346 | Tragic 47.6% |
| Yup'ik | 0.0 /100 | #347 | Tragic 45.8% |