Immigrants from Nigeria vs British High School Diploma
COMPARE
Immigrants from Nigeria
British
High School Diploma
High School Diploma Comparison
Immigrants from Nigeria
British
87.7%
HIGH SCHOOL DIPLOMA
1.5/ 100
METRIC RATING
250th/ 347
METRIC RANK
91.3%
HIGH SCHOOL DIPLOMA
99.8/ 100
METRIC RATING
43rd/ 347
METRIC RANK
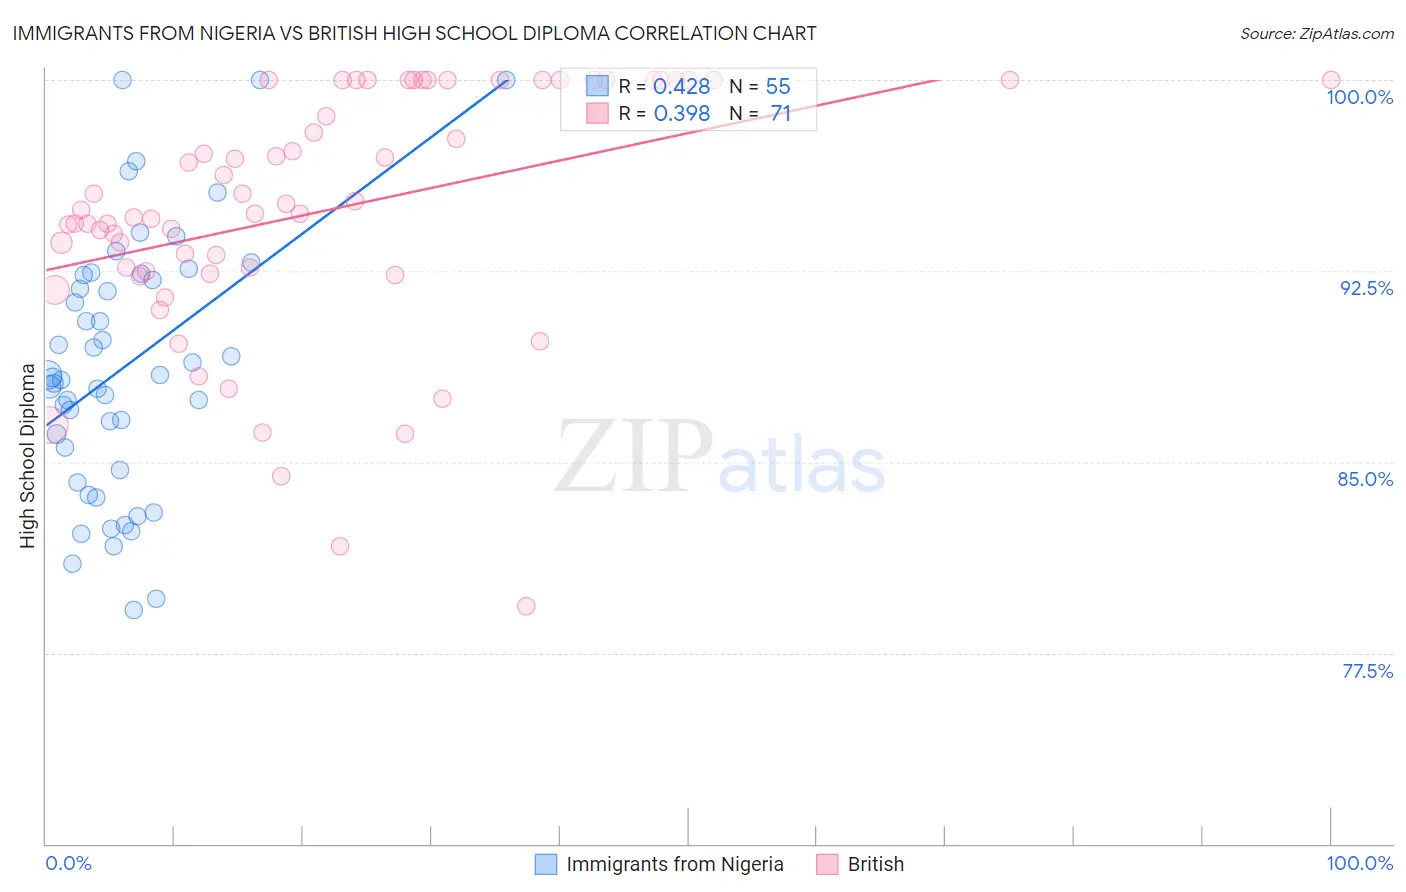
Immigrants from Nigeria vs British High School Diploma Correlation Chart
The statistical analysis conducted on geographies consisting of 283,441,873 people shows a moderate positive correlation between the proportion of Immigrants from Nigeria and percentage of population with at least high school diploma education in the United States with a correlation coefficient (R) of 0.428 and weighted average of 87.7%. Similarly, the statistical analysis conducted on geographies consisting of 531,463,566 people shows a mild positive correlation between the proportion of British and percentage of population with at least high school diploma education in the United States with a correlation coefficient (R) of 0.398 and weighted average of 91.3%, a difference of 4.0%.
High School Diploma Correlation Summary
| Measurement | Immigrants from Nigeria | British |
| Minimum | 79.2% | 79.3% |
| Maximum | 100.0% | 100.0% |
| Range | 20.8% | 20.7% |
| Mean | 88.7% | 94.9% |
| Median | 88.3% | 94.9% |
| Interquartile 25% (IQ1) | 84.7% | 92.5% |
| Interquartile 75% (IQ3) | 92.3% | 100.0% |
| Interquartile Range (IQR) | 7.7% | 7.5% |
| Standard Deviation (Sample) | 5.1% | 4.8% |
| Standard Deviation (Population) | 5.0% | 4.8% |
Similar Demographics by High School Diploma
Demographics Similar to Immigrants from Nigeria by High School Diploma
In terms of high school diploma, the demographic groups most similar to Immigrants from Nigeria are Senegalese (87.7%, a difference of 0.0%), Spanish American (87.7%, a difference of 0.010%), Ghanaian (87.7%, a difference of 0.040%), Immigrants from Eritrea (87.8%, a difference of 0.050%), and Immigrants from Costa Rica (87.8%, a difference of 0.050%).
| Demographics | Rating | Rank | High School Diploma |
| Immigrants | Philippines | 1.9 /100 | #243 | Tragic 87.8% |
| Choctaw | 1.9 /100 | #244 | Tragic 87.8% |
| Peruvians | 1.9 /100 | #245 | Tragic 87.8% |
| Immigrants | Eritrea | 1.7 /100 | #246 | Tragic 87.8% |
| Immigrants | Costa Rica | 1.7 /100 | #247 | Tragic 87.8% |
| Spanish Americans | 1.5 /100 | #248 | Tragic 87.7% |
| Senegalese | 1.5 /100 | #249 | Tragic 87.7% |
| Immigrants | Nigeria | 1.5 /100 | #250 | Tragic 87.7% |
| Ghanaians | 1.4 /100 | #251 | Tragic 87.7% |
| Immigrants | South America | 1.2 /100 | #252 | Tragic 87.6% |
| Immigrants | Uruguay | 1.0 /100 | #253 | Tragic 87.6% |
| Immigrants | Colombia | 1.0 /100 | #254 | Tragic 87.6% |
| Immigrants | Senegal | 0.9 /100 | #255 | Tragic 87.6% |
| Africans | 0.7 /100 | #256 | Tragic 87.5% |
| Bahamians | 0.7 /100 | #257 | Tragic 87.5% |
Demographics Similar to British by High School Diploma
In terms of high school diploma, the demographic groups most similar to British are Immigrants from Australia (91.3%, a difference of 0.010%), Northern European (91.3%, a difference of 0.010%), Immigrants from Austria (91.3%, a difference of 0.010%), Turkish (91.2%, a difference of 0.020%), and Dutch (91.3%, a difference of 0.040%).
| Demographics | Rating | Rank | High School Diploma |
| Tsimshian | 99.9 /100 | #36 | Exceptional 91.3% |
| Immigrants | Ireland | 99.9 /100 | #37 | Exceptional 91.3% |
| Immigrants | Scotland | 99.8 /100 | #38 | Exceptional 91.3% |
| Dutch | 99.8 /100 | #39 | Exceptional 91.3% |
| Immigrants | Lithuania | 99.8 /100 | #40 | Exceptional 91.3% |
| Immigrants | Australia | 99.8 /100 | #41 | Exceptional 91.3% |
| Northern Europeans | 99.8 /100 | #42 | Exceptional 91.3% |
| British | 99.8 /100 | #43 | Exceptional 91.3% |
| Immigrants | Austria | 99.8 /100 | #44 | Exceptional 91.3% |
| Turks | 99.8 /100 | #45 | Exceptional 91.2% |
| Greeks | 99.8 /100 | #46 | Exceptional 91.2% |
| Australians | 99.8 /100 | #47 | Exceptional 91.2% |
| Belgians | 99.8 /100 | #48 | Exceptional 91.2% |
| Bhutanese | 99.8 /100 | #49 | Exceptional 91.2% |
| Welsh | 99.8 /100 | #50 | Exceptional 91.2% |