Immigrants from Moldova vs Lebanese 9th Grade

COMPARE

Immigrants from Moldova
Race
Ancestry
AfghanAfricanAlaska NativeAlaskan AthabascanAlbanianAleutAlsatianAmericanApacheArabArapahoArgentineanArmenianAssyrian/Chaldean/SyriacAustralianAustrianBahamianBangladeshiBarbadianBasqueBelgianBelizeanBermudanBhutaneseBlackfeetBolivianBrazilianBritishBritish West IndianBulgarianBurmeseCajunCambodianCanadianCape VerdeanCarpatho RusynCelticCentral AmericanCentral American IndianCherokeeCheyenneChickasawChileanChineseChippewaChoctawColombianColvilleComancheCosta RicanCreeCreekCroatianCrowCubanCypriotCzechCzechoslovakianDanishDelawareDominicanDutchDutch West IndianEastern EuropeanEcuadorianEgyptianEnglishEstonianEthiopianEuropeanFijianFilipinoFinnishFrenchFrench American IndianFrench CanadianGermanGerman RussianGhanaianGreekGuamanian/ChamorroGuatemalanGuyaneseHaitianHmongHonduranHopiHoumaHungarianIcelanderIndian (Asian)IndonesianInupiatIranianIraqiIrishIroquoisIsraeliItalianJamaicanJapaneseJordanianKenyanKiowaKoreanLaotianLatvianLiberianLithuanianLumbeeLuxembourgerMacedonianMalaysianMalteseMarshalleseMenomineeMexicanMexican American IndianMongolianMoroccanNative HawaiianNavajoNepaleseNew ZealanderNicaraguanNigerianNorthern EuropeanNorwegianOkinawanOsageOttawaPaiutePakistaniPalestinianPanamanianParaguayanPennsylvania GermanPeruvianPimaPolishPortuguesePotawatomiPuebloPuerto RicanPuget Sound SalishRomanianRussianSalvadoranSamoanScandinavianScotch-IrishScottishSeminoleSenegaleseSerbianShoshoneSierra LeoneanSiouxSlavicSlovakSloveneSomaliSouth AfricanSouth AmericanSouth American IndianSoviet UnionSpaniardSpanishSpanish AmericanSpanish American IndianSri LankanSubsaharan AfricanSudaneseSwedishSwissSyrianTaiwaneseThaiTlingit-HaidaTohono O'OdhamTonganTrinidadian and TobagonianTsimshianTurkishU.S. Virgin IslanderUgandanUkrainianUruguayanUteVenezuelanVietnameseWelshWest IndianYakamaYaquiYugoslavianYumanYup'ikZimbabwean
Immigration
NonimmigrantsImmigrantsAfghanistanAfricaAlbaniaArgentinaArmeniaAsiaAustraliaAustriaBahamasBangladeshBarbadosBelarusBelgiumBelizeBoliviaBosnia and HerzegovinaBrazilBulgariaBurma/MyanmarCabo VerdeCambodiaCameroonCanadaCaribbeanCentral AmericaChileChinaColombiaCongoCosta RicaCroatiaCubaCzechoslovakiaDenmarkDominicaDominican RepublicEastern AfricaEastern AsiaEastern EuropeEcuadorEgyptEl SalvadorEnglandEritreaEthiopiaEuropeFijiFranceGermanyGhanaGreeceGrenadaGuatemalaGuyanaHaitiHondurasHong KongHungaryIndiaIndonesiaIranIraqIrelandIsraelItalyJamaicaJapanJordanKazakhstanKenyaKoreaKuwaitLaosLatin AmericaLatviaLebanonLiberiaLithuaniaMalaysiaMexicoMicronesiaMiddle AfricaMoldovaMoroccoNepalNetherlandsNicaraguaNigeriaNorth AmericaNorth MacedoniaNorthern AfricaNorthern EuropeNorwayOceaniaPakistanPanamaPeruPhilippinesPolandPortugalRomaniaRussiaSaudi ArabiaScotlandSenegalSerbiaSierra LeoneSingaporeSomaliaSouth AfricaSouth AmericaSouth Central AsiaSouth Eastern AsiaSouthern EuropeSpainSri LankaSt. Vincent and the GrenadinesSudanSwedenSwitzerlandSyriaTaiwanThailandTrinidad and TobagoTurkeyUgandaUkraineUruguayUzbekistanVenezuelaVietnamWest IndiesWestern AfricaWestern AsiaWestern EuropeYemenZaireZimbabweAzores
Lebanese
Race
Ancestry
AfghanAfricanAlaska NativeAlaskan AthabascanAlbanianAleutAlsatianAmericanApacheArabArapahoArgentineanArmenianAssyrian/Chaldean/SyriacAustralianAustrianBahamianBangladeshiBarbadianBasqueBelgianBelizeanBermudanBhutaneseBlackfeetBolivianBrazilianBritishBritish West IndianBulgarianBurmeseCajunCambodianCanadianCape VerdeanCarpatho RusynCelticCentral AmericanCentral American IndianCherokeeCheyenneChickasawChileanChineseChippewaChoctawColombianColvilleComancheCosta RicanCreeCreekCroatianCrowCubanCypriotCzechCzechoslovakianDanishDelawareDominicanDutchDutch West IndianEastern EuropeanEcuadorianEgyptianEnglishEstonianEthiopianEuropeanFijianFilipinoFinnishFrenchFrench American IndianFrench CanadianGermanGerman RussianGhanaianGreekGuamanian/ChamorroGuatemalanGuyaneseHaitianHmongHonduranHopiHoumaHungarianIcelanderIndian (Asian)IndonesianInupiatIranianIraqiIrishIroquoisIsraeliItalianJamaicanJapaneseJordanianKenyanKiowaKoreanLaotianLatvianLebaneseLiberianLithuanianLumbeeLuxembourgerMacedonianMalaysianMalteseMarshalleseMenomineeMexicanMexican American IndianMongolianMoroccanNative HawaiianNavajoNepaleseNew ZealanderNicaraguanNigerianNorthern EuropeanNorwegianOkinawanOsageOttawaPaiutePakistaniPalestinianPanamanianParaguayanPennsylvania GermanPeruvianPimaPolishPortuguesePotawatomiPuebloPuerto RicanPuget Sound SalishRomanianRussianSalvadoranSamoanScandinavianScotch-IrishScottishSeminoleSenegaleseSerbianShoshoneSierra LeoneanSiouxSlavicSlovakSloveneSomaliSouth AfricanSouth AmericanSouth American IndianSoviet UnionSpaniardSpanishSpanish AmericanSpanish American IndianSri LankanSubsaharan AfricanSudaneseSwedishSwissSyrianTaiwaneseThaiTlingit-HaidaTohono O'OdhamTonganTrinidadian and TobagonianTsimshianTurkishU.S. Virgin IslanderUgandanUkrainianUruguayanUteVenezuelanVietnameseWelshWest IndianYakamaYaquiYugoslavianYumanYup'ikZimbabwean
Immigration
NonimmigrantsImmigrantsAfghanistanAfricaAlbaniaArgentinaArmeniaAsiaAustraliaAustriaBahamasBangladeshBarbadosBelarusBelgiumBelizeBoliviaBosnia and HerzegovinaBrazilBulgariaBurma/MyanmarCabo VerdeCambodiaCameroonCanadaCaribbeanCentral AmericaChileChinaColombiaCongoCosta RicaCroatiaCubaCzechoslovakiaDenmarkDominicaDominican RepublicEastern AfricaEastern AsiaEastern EuropeEcuadorEgyptEl SalvadorEnglandEritreaEthiopiaEuropeFijiFranceGermanyGhanaGreeceGrenadaGuatemalaGuyanaHaitiHondurasHong KongHungaryIndiaIndonesiaIranIraqIrelandIsraelItalyJamaicaJapanJordanKazakhstanKenyaKoreaKuwaitLaosLatin AmericaLatviaLebanonLiberiaLithuaniaMalaysiaMexicoMicronesiaMiddle AfricaMoroccoNepalNetherlandsNicaraguaNigeriaNorth AmericaNorth MacedoniaNorthern AfricaNorthern EuropeNorwayOceaniaPakistanPanamaPeruPhilippinesPolandPortugalRomaniaRussiaSaudi ArabiaScotlandSenegalSerbiaSierra LeoneSingaporeSomaliaSouth AfricaSouth AmericaSouth Central AsiaSouth Eastern AsiaSouthern EuropeSpainSri LankaSt. Vincent and the GrenadinesSudanSwedenSwitzerlandSyriaTaiwanThailandTrinidad and TobagoTurkeyUgandaUkraineUruguayUzbekistanVenezuelaVietnamWest IndiesWestern AfricaWestern AsiaWestern EuropeYemenZaireZimbabweAzores
9th Grade
Income
Poverty
Unemployment
Labor Participation
Family Structure
Vehicle Availability
Education Level
Disability

9th Grade Comparison

Immigrants from Moldova

Lebanese

Exceptional
Exceptional
95.5%
9TH GRADE
97.9/ 100
METRIC RATING
101st/ 347
METRIC RANK
95.6%
9TH GRADE
98.1/ 100
METRIC RATING
100th/ 347
METRIC RANK

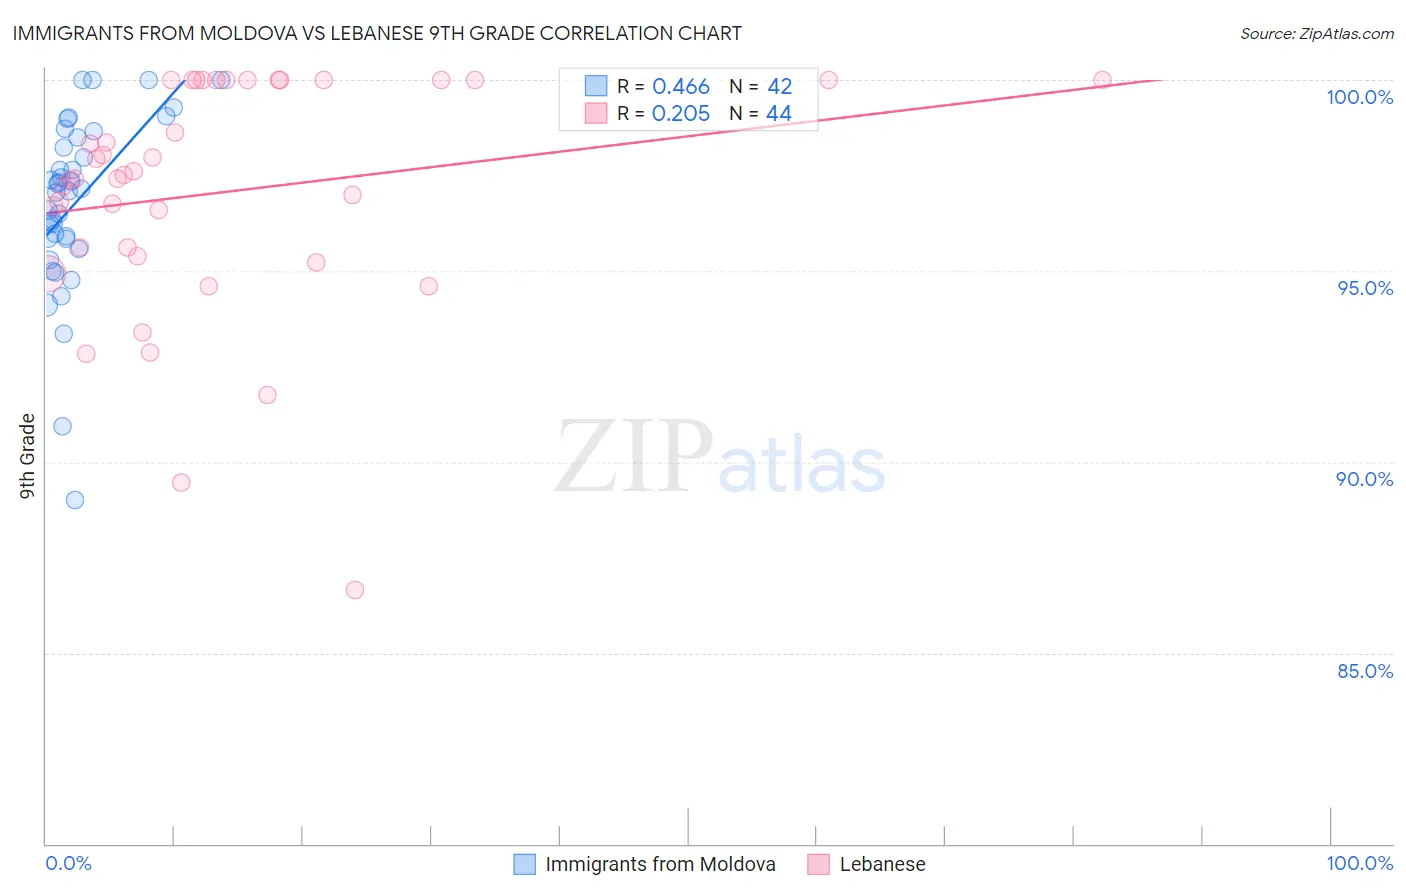
Immigrants from Moldova vs Lebanese 9th Grade Correlation Chart

The statistical analysis conducted on geographies consisting of 124,396,843 people shows a moderate positive correlation between the proportion of Immigrants from Moldova and percentage of population with at least 9th grade education in the United States with a correlation coefficient (R) of 0.466 and weighted average of 95.5%. Similarly, the statistical analysis conducted on geographies consisting of 401,624,157 people shows a weak positive correlation between the proportion of Lebanese and percentage of population with at least 9th grade education in the United States with a correlation coefficient (R) of 0.205 and weighted average of 95.6%, a difference of 0.020%.
Immigrants from Moldova vs Lebanese 9th Grade

9th Grade Correlation Summary

MeasurementImmigrants from MoldovaLebanese
Minimum89.0%86.6%
Maximum100.0%100.0%
Range11.0%13.4%
Mean96.8%97.1%
Median97.1%97.5%
Interquartile 25% (IQ1)95.8%95.5%
Interquartile 75% (IQ3)98.5%100.0%
Interquartile Range (IQR)2.6%4.5%
Standard Deviation (Sample)2.3%3.1%
Standard Deviation (Population)2.3%3.0%

Demographics Similar to Immigrants from Moldova and Lebanese by 9th Grade

In terms of 9th grade, the demographic groups most similar to Immigrants from Moldova are Immigrants from Switzerland (95.5%, a difference of 0.010%), Potawatomi (95.5%, a difference of 0.020%), Menominee (95.6%, a difference of 0.040%), Syrian (95.5%, a difference of 0.040%), and Immigrants from France (95.5%, a difference of 0.040%). Similarly, the demographic groups most similar to Lebanese are Immigrants from Japan (95.6%, a difference of 0.020%), Menominee (95.6%, a difference of 0.020%), Delaware (95.6%, a difference of 0.030%), American (95.6%, a difference of 0.040%), and Filipino (95.6%, a difference of 0.040%).
DemographicsRating | Rank9th Grade
South Africans
98.8
/100
|
#90
Exceptional
95.6%
Creek
98.8
/100
|
#91
Exceptional
95.6%
Immigrants | Saudi Arabia
98.8
/100
|
#92
Exceptional
95.6%
Immigrants | Germany
98.7
/100
|
#93
Exceptional
95.6%
Immigrants | Latvia
98.7
/100
|
#94
Exceptional
95.6%
Americans
98.5
/100
|
#95
Exceptional
95.6%
Filipinos
98.5
/100
|
#96
Exceptional
95.6%
Delaware
98.4
/100
|
#97
Exceptional
95.6%
Immigrants | Japan
98.4
/100
|
#98
Exceptional
95.6%
Menominee
98.3
/100
|
#99
Exceptional
95.6%
Lebanese
98.1
/100
|
#100
Exceptional
95.6%
Immigrants | Moldova
97.9
/100
|
#101
Exceptional
95.5%
Immigrants | Switzerland
97.7
/100
|
#102
Exceptional
95.5%
Potawatomi
97.7
/100
|
#103
Exceptional
95.5%
Syrians
97.4
/100
|
#104
Exceptional
95.5%
Immigrants | France
97.4
/100
|
#105
Exceptional
95.5%
Immigrants | Norway
97.1
/100
|
#106
Exceptional
95.5%
Immigrants | Zimbabwe
96.9
/100
|
#107
Exceptional
95.5%
Chickasaw
96.8
/100
|
#108
Exceptional
95.5%
Osage
96.8
/100
|
#109
Exceptional
95.5%
Immigrants | Bulgaria
96.7
/100
|
#110
Exceptional
95.5%