Immigrants from Moldova vs Dutch 9th Grade

COMPARE

Immigrants from Moldova
Race
Ancestry
AfghanAfricanAlaska NativeAlaskan AthabascanAlbanianAleutAlsatianAmericanApacheArabArapahoArgentineanArmenianAssyrian/Chaldean/SyriacAustralianAustrianBahamianBangladeshiBarbadianBasqueBelgianBelizeanBermudanBhutaneseBlackfeetBolivianBrazilianBritishBritish West IndianBulgarianBurmeseCajunCambodianCanadianCape VerdeanCarpatho RusynCelticCentral AmericanCentral American IndianCherokeeCheyenneChickasawChileanChineseChippewaChoctawColombianColvilleComancheCosta RicanCreeCreekCroatianCrowCubanCypriotCzechCzechoslovakianDanishDelawareDominicanDutch West IndianEastern EuropeanEcuadorianEgyptianEnglishEstonianEthiopianEuropeanFijianFilipinoFinnishFrenchFrench American IndianFrench CanadianGermanGerman RussianGhanaianGreekGuamanian/ChamorroGuatemalanGuyaneseHaitianHmongHonduranHopiHoumaHungarianIcelanderIndian (Asian)IndonesianInupiatIranianIraqiIrishIroquoisIsraeliItalianJamaicanJapaneseJordanianKenyanKiowaKoreanLaotianLatvianLebaneseLiberianLithuanianLumbeeLuxembourgerMacedonianMalaysianMalteseMarshalleseMenomineeMexicanMexican American IndianMongolianMoroccanNative HawaiianNavajoNepaleseNew ZealanderNicaraguanNigerianNorthern EuropeanNorwegianOkinawanOsageOttawaPaiutePakistaniPalestinianPanamanianParaguayanPennsylvania GermanPeruvianPimaPolishPortuguesePotawatomiPuebloPuerto RicanPuget Sound SalishRomanianRussianSalvadoranSamoanScandinavianScotch-IrishScottishSeminoleSenegaleseSerbianShoshoneSierra LeoneanSiouxSlavicSlovakSloveneSomaliSouth AfricanSouth AmericanSouth American IndianSoviet UnionSpaniardSpanishSpanish AmericanSpanish American IndianSri LankanSubsaharan AfricanSudaneseSwedishSwissSyrianTaiwaneseThaiTlingit-HaidaTohono O'OdhamTonganTrinidadian and TobagonianTsimshianTurkishU.S. Virgin IslanderUgandanUkrainianUruguayanUteVenezuelanVietnameseWelshWest IndianYakamaYaquiYugoslavianYumanYup'ikZimbabwean
Immigration
NonimmigrantsImmigrantsAfghanistanAfricaAlbaniaArgentinaArmeniaAsiaAustraliaAustriaBahamasBangladeshBarbadosBelarusBelgiumBelizeBoliviaBosnia and HerzegovinaBrazilBulgariaBurma/MyanmarCabo VerdeCambodiaCameroonCanadaCaribbeanCentral AmericaChileChinaColombiaCongoCosta RicaCroatiaCubaCzechoslovakiaDenmarkDominicaDominican RepublicEastern AfricaEastern AsiaEastern EuropeEcuadorEgyptEl SalvadorEnglandEritreaEthiopiaEuropeFijiFranceGermanyGhanaGreeceGrenadaGuatemalaGuyanaHaitiHondurasHong KongHungaryIndiaIndonesiaIranIraqIrelandIsraelItalyJamaicaJapanJordanKazakhstanKenyaKoreaKuwaitLaosLatin AmericaLatviaLebanonLiberiaLithuaniaMalaysiaMexicoMicronesiaMiddle AfricaMoldovaMoroccoNepalNetherlandsNicaraguaNigeriaNorth AmericaNorth MacedoniaNorthern AfricaNorthern EuropeNorwayOceaniaPakistanPanamaPeruPhilippinesPolandPortugalRomaniaRussiaSaudi ArabiaScotlandSenegalSerbiaSierra LeoneSingaporeSomaliaSouth AfricaSouth AmericaSouth Central AsiaSouth Eastern AsiaSouthern EuropeSpainSri LankaSt. Vincent and the GrenadinesSudanSwedenSwitzerlandSyriaTaiwanThailandTrinidad and TobagoTurkeyUgandaUkraineUruguayUzbekistanVenezuelaVietnamWest IndiesWestern AfricaWestern AsiaWestern EuropeYemenZaireZimbabweAzores
Dutch
Race
Ancestry
AfghanAfricanAlaska NativeAlaskan AthabascanAlbanianAleutAlsatianAmericanApacheArabArapahoArgentineanArmenianAssyrian/Chaldean/SyriacAustralianAustrianBahamianBangladeshiBarbadianBasqueBelgianBelizeanBermudanBhutaneseBlackfeetBolivianBrazilianBritishBritish West IndianBulgarianBurmeseCajunCambodianCanadianCape VerdeanCarpatho RusynCelticCentral AmericanCentral American IndianCherokeeCheyenneChickasawChileanChineseChippewaChoctawColombianColvilleComancheCosta RicanCreeCreekCroatianCrowCubanCypriotCzechCzechoslovakianDanishDelawareDominicanDutchDutch West IndianEastern EuropeanEcuadorianEgyptianEnglishEstonianEthiopianEuropeanFijianFilipinoFinnishFrenchFrench American IndianFrench CanadianGermanGerman RussianGhanaianGreekGuamanian/ChamorroGuatemalanGuyaneseHaitianHmongHonduranHopiHoumaHungarianIcelanderIndian (Asian)IndonesianInupiatIranianIraqiIrishIroquoisIsraeliItalianJamaicanJapaneseJordanianKenyanKiowaKoreanLaotianLatvianLebaneseLiberianLithuanianLumbeeLuxembourgerMacedonianMalaysianMalteseMarshalleseMenomineeMexicanMexican American IndianMongolianMoroccanNative HawaiianNavajoNepaleseNew ZealanderNicaraguanNigerianNorthern EuropeanNorwegianOkinawanOsageOttawaPaiutePakistaniPalestinianPanamanianParaguayanPennsylvania GermanPeruvianPimaPolishPortuguesePotawatomiPuebloPuerto RicanPuget Sound SalishRomanianRussianSalvadoranSamoanScandinavianScotch-IrishScottishSeminoleSenegaleseSerbianShoshoneSierra LeoneanSiouxSlavicSlovakSloveneSomaliSouth AfricanSouth AmericanSouth American IndianSoviet UnionSpaniardSpanishSpanish AmericanSpanish American IndianSri LankanSubsaharan AfricanSudaneseSwedishSwissSyrianTaiwaneseThaiTlingit-HaidaTohono O'OdhamTonganTrinidadian and TobagonianTsimshianTurkishU.S. Virgin IslanderUgandanUkrainianUruguayanUteVenezuelanVietnameseWelshWest IndianYakamaYaquiYugoslavianYumanYup'ikZimbabwean
Immigration
NonimmigrantsImmigrantsAfghanistanAfricaAlbaniaArgentinaArmeniaAsiaAustraliaAustriaBahamasBangladeshBarbadosBelarusBelgiumBelizeBoliviaBosnia and HerzegovinaBrazilBulgariaBurma/MyanmarCabo VerdeCambodiaCameroonCanadaCaribbeanCentral AmericaChileChinaColombiaCongoCosta RicaCroatiaCubaCzechoslovakiaDenmarkDominicaDominican RepublicEastern AfricaEastern AsiaEastern EuropeEcuadorEgyptEl SalvadorEnglandEritreaEthiopiaEuropeFijiFranceGermanyGhanaGreeceGrenadaGuatemalaGuyanaHaitiHondurasHong KongHungaryIndiaIndonesiaIranIraqIrelandIsraelItalyJamaicaJapanJordanKazakhstanKenyaKoreaKuwaitLaosLatin AmericaLatviaLebanonLiberiaLithuaniaMalaysiaMexicoMicronesiaMiddle AfricaMoroccoNepalNetherlandsNicaraguaNigeriaNorth AmericaNorth MacedoniaNorthern AfricaNorthern EuropeNorwayOceaniaPakistanPanamaPeruPhilippinesPolandPortugalRomaniaRussiaSaudi ArabiaScotlandSenegalSerbiaSierra LeoneSingaporeSomaliaSouth AfricaSouth AmericaSouth Central AsiaSouth Eastern AsiaSouthern EuropeSpainSri LankaSt. Vincent and the GrenadinesSudanSwedenSwitzerlandSyriaTaiwanThailandTrinidad and TobagoTurkeyUgandaUkraineUruguayUzbekistanVenezuelaVietnamWest IndiesWestern AfricaWestern AsiaWestern EuropeYemenZaireZimbabweAzores
9th Grade
Income
Poverty
Unemployment
Labor Participation
Family Structure
Vehicle Availability
Education Level
Disability

9th Grade Comparison

Immigrants from Moldova

Dutch

Exceptional
Exceptional
95.5%
9TH GRADE
97.9/ 100
METRIC RATING
101st/ 347
METRIC RANK
96.5%
9TH GRADE
100.0/ 100
METRIC RATING
17th/ 347
METRIC RANK

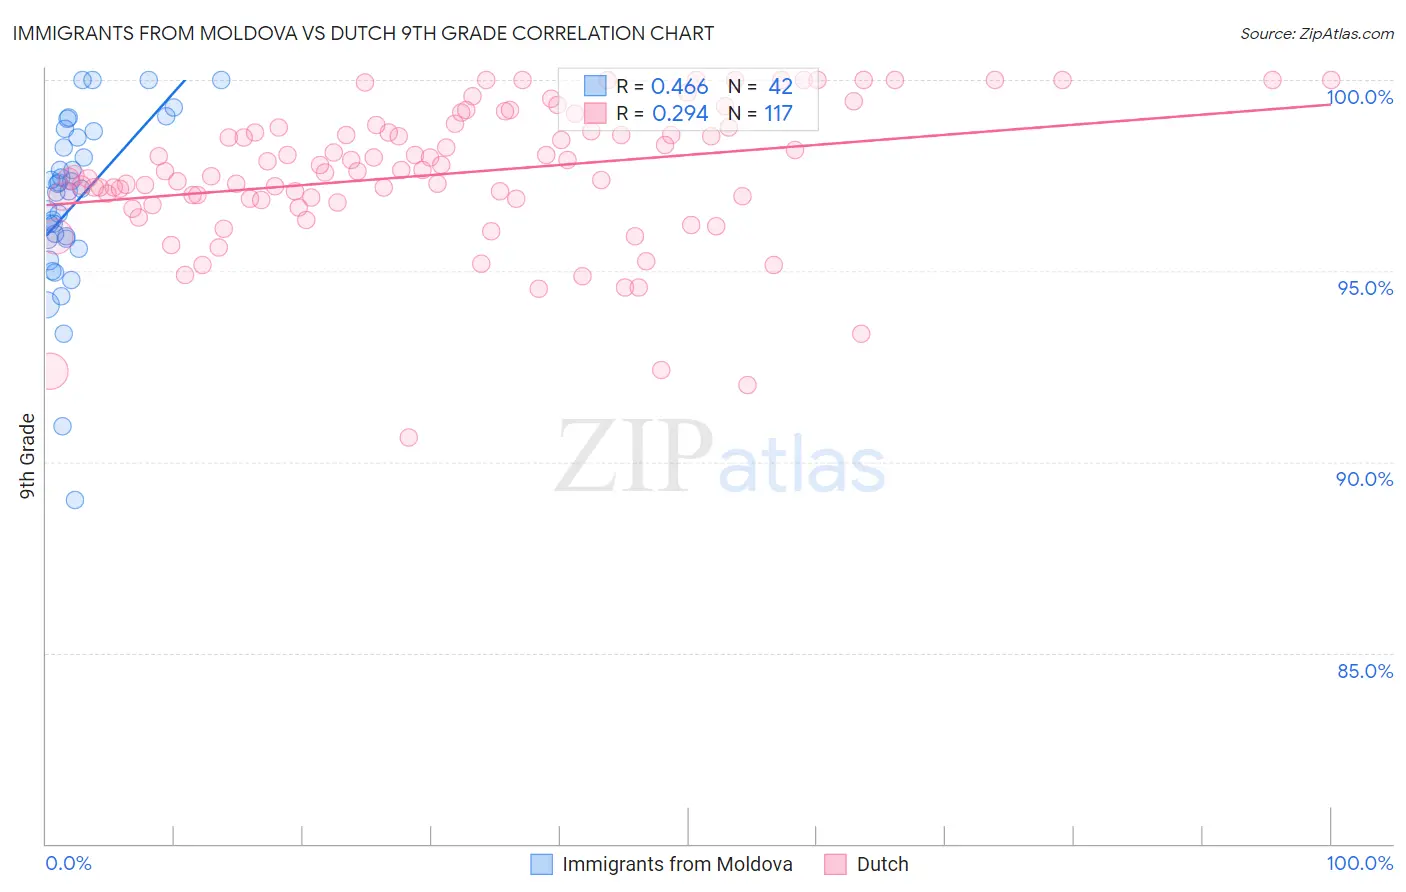
Immigrants from Moldova vs Dutch 9th Grade Correlation Chart

The statistical analysis conducted on geographies consisting of 124,396,843 people shows a moderate positive correlation between the proportion of Immigrants from Moldova and percentage of population with at least 9th grade education in the United States with a correlation coefficient (R) of 0.466 and weighted average of 95.5%. Similarly, the statistical analysis conducted on geographies consisting of 554,359,196 people shows a weak positive correlation between the proportion of Dutch and percentage of population with at least 9th grade education in the United States with a correlation coefficient (R) of 0.294 and weighted average of 96.5%, a difference of 0.97%.
Immigrants from Moldova vs Dutch 9th Grade

9th Grade Correlation Summary

MeasurementImmigrants from MoldovaDutch
Minimum89.0%90.6%
Maximum100.0%100.0%
Range11.0%9.4%
Mean96.8%97.5%
Median97.1%97.6%
Interquartile 25% (IQ1)95.8%96.9%
Interquartile 75% (IQ3)98.5%98.8%
Interquartile Range (IQR)2.6%1.9%
Standard Deviation (Sample)2.3%1.8%
Standard Deviation (Population)2.3%1.8%

Similar Demographics by 9th Grade

Demographics Similar to Immigrants from Moldova by 9th Grade

In terms of 9th grade, the demographic groups most similar to Immigrants from Moldova are Immigrants from Switzerland (95.5%, a difference of 0.010%), Lebanese (95.6%, a difference of 0.020%), Potawatomi (95.5%, a difference of 0.020%), Menominee (95.6%, a difference of 0.040%), and Syrian (95.5%, a difference of 0.040%).
DemographicsRating | Rank9th Grade
Immigrants | Latvia
98.7
/100
|
#94
Exceptional
95.6%
Americans
98.5
/100
|
#95
Exceptional
95.6%
Filipinos
98.5
/100
|
#96
Exceptional
95.6%
Delaware
98.4
/100
|
#97
Exceptional
95.6%
Immigrants | Japan
98.4
/100
|
#98
Exceptional
95.6%
Menominee
98.3
/100
|
#99
Exceptional
95.6%
Lebanese
98.1
/100
|
#100
Exceptional
95.6%
Immigrants | Moldova
97.9
/100
|
#101
Exceptional
95.5%
Immigrants | Switzerland
97.7
/100
|
#102
Exceptional
95.5%
Potawatomi
97.7
/100
|
#103
Exceptional
95.5%
Syrians
97.4
/100
|
#104
Exceptional
95.5%
Immigrants | France
97.4
/100
|
#105
Exceptional
95.5%
Immigrants | Norway
97.1
/100
|
#106
Exceptional
95.5%
Immigrants | Zimbabwe
96.9
/100
|
#107
Exceptional
95.5%
Chickasaw
96.8
/100
|
#108
Exceptional
95.5%

Demographics Similar to Dutch by 9th Grade

In terms of 9th grade, the demographic groups most similar to Dutch are Scandinavian (96.5%, a difference of 0.020%), Welsh (96.4%, a difference of 0.050%), Irish (96.5%, a difference of 0.060%), Croatian (96.5%, a difference of 0.060%), and Italian (96.4%, a difference of 0.060%).
DemographicsRating | Rank9th Grade
Lithuanians
100.0
/100
|
#10
Exceptional
96.6%
Finns
100.0
/100
|
#11
Exceptional
96.6%
English
100.0
/100
|
#12
Exceptional
96.6%
Danes
100.0
/100
|
#13
Exceptional
96.5%
Scottish
100.0
/100
|
#14
Exceptional
96.5%
Irish
100.0
/100
|
#15
Exceptional
96.5%
Croatians
100.0
/100
|
#16
Exceptional
96.5%
Dutch
100.0
/100
|
#17
Exceptional
96.5%
Scandinavians
100.0
/100
|
#18
Exceptional
96.5%
Welsh
100.0
/100
|
#19
Exceptional
96.4%
Italians
100.0
/100
|
#20
Exceptional
96.4%
Alaskan Athabascans
100.0
/100
|
#21
Exceptional
96.4%
Europeans
100.0
/100
|
#22
Exceptional
96.4%
Czechs
100.0
/100
|
#23
Exceptional
96.4%
Latvians
100.0
/100
|
#24
Exceptional
96.4%