Immigrants from Liberia vs Immigrants from Burma/Myanmar 11th Grade

COMPARE

Immigrants from Liberia
Race
Ancestry
AfghanAfricanAlaska NativeAlaskan AthabascanAlbanianAleutAlsatianAmericanApacheArabArapahoArgentineanArmenianAssyrian/Chaldean/SyriacAustralianAustrianBahamianBangladeshiBarbadianBasqueBelgianBelizeanBermudanBhutaneseBlackfeetBolivianBrazilianBritishBritish West IndianBulgarianBurmeseCajunCambodianCanadianCape VerdeanCarpatho RusynCelticCentral AmericanCentral American IndianCherokeeCheyenneChickasawChileanChineseChippewaChoctawColombianColvilleComancheCosta RicanCreeCreekCroatianCrowCubanCypriotCzechCzechoslovakianDanishDelawareDominicanDutchDutch West IndianEastern EuropeanEcuadorianEgyptianEnglishEstonianEthiopianEuropeanFijianFilipinoFinnishFrenchFrench American IndianFrench CanadianGermanGerman RussianGhanaianGreekGuamanian/ChamorroGuatemalanGuyaneseHaitianHmongHonduranHopiHoumaHungarianIcelanderIndian (Asian)IndonesianInupiatIranianIraqiIrishIroquoisIsraeliItalianJamaicanJapaneseJordanianKenyanKiowaKoreanLaotianLatvianLebaneseLiberianLithuanianLumbeeLuxembourgerMacedonianMalaysianMalteseMarshalleseMenomineeMexicanMexican American IndianMongolianMoroccanNative HawaiianNavajoNepaleseNew ZealanderNicaraguanNigerianNorthern EuropeanNorwegianOkinawanOsageOttawaPaiutePakistaniPalestinianPanamanianParaguayanPennsylvania GermanPeruvianPimaPolishPortuguesePotawatomiPuebloPuerto RicanPuget Sound SalishRomanianRussianSalvadoranSamoanScandinavianScotch-IrishScottishSeminoleSenegaleseSerbianShoshoneSierra LeoneanSiouxSlavicSlovakSloveneSomaliSouth AfricanSouth AmericanSouth American IndianSoviet UnionSpaniardSpanishSpanish AmericanSpanish American IndianSri LankanSubsaharan AfricanSudaneseSwedishSwissSyrianTaiwaneseThaiTlingit-HaidaTohono O'OdhamTonganTrinidadian and TobagonianTsimshianTurkishU.S. Virgin IslanderUgandanUkrainianUruguayanUteVenezuelanVietnameseWelshWest IndianYakamaYaquiYugoslavianYumanYup'ikZimbabwean
Immigration
NonimmigrantsImmigrantsAfghanistanAfricaAlbaniaArgentinaArmeniaAsiaAustraliaAustriaBahamasBangladeshBarbadosBelarusBelgiumBelizeBoliviaBosnia and HerzegovinaBrazilBulgariaCabo VerdeCambodiaCameroonCanadaCaribbeanCentral AmericaChileChinaColombiaCongoCosta RicaCroatiaCubaCzechoslovakiaDenmarkDominicaDominican RepublicEastern AfricaEastern AsiaEastern EuropeEcuadorEgyptEl SalvadorEnglandEritreaEthiopiaEuropeFijiFranceGermanyGhanaGreeceGrenadaGuatemalaGuyanaHaitiHondurasHong KongHungaryIndiaIndonesiaIranIraqIrelandIsraelItalyJamaicaJapanJordanKazakhstanKenyaKoreaKuwaitLaosLatin AmericaLatviaLebanonLiberiaLithuaniaMalaysiaMexicoMicronesiaMiddle AfricaMoldovaMoroccoNepalNetherlandsNicaraguaNigeriaNorth AmericaNorth MacedoniaNorthern AfricaNorthern EuropeNorwayOceaniaPakistanPanamaPeruPhilippinesPolandPortugalRomaniaRussiaSaudi ArabiaScotlandSenegalSerbiaSierra LeoneSingaporeSomaliaSouth AfricaSouth AmericaSouth Central AsiaSouth Eastern AsiaSouthern EuropeSpainSri LankaSt. Vincent and the GrenadinesSudanSwedenSwitzerlandSyriaTaiwanThailandTrinidad and TobagoTurkeyUgandaUkraineUruguayUzbekistanVenezuelaVietnamWest IndiesWestern AfricaWestern AsiaWestern EuropeYemenZaireZimbabweAzores
Immigrants from Burma/Myanmar
Race
Ancestry
AfghanAfricanAlaska NativeAlaskan AthabascanAlbanianAleutAlsatianAmericanApacheArabArapahoArgentineanArmenianAssyrian/Chaldean/SyriacAustralianAustrianBahamianBangladeshiBarbadianBasqueBelgianBelizeanBermudanBhutaneseBlackfeetBolivianBrazilianBritishBritish West IndianBulgarianBurmeseCajunCambodianCanadianCape VerdeanCarpatho RusynCelticCentral AmericanCentral American IndianCherokeeCheyenneChickasawChileanChineseChippewaChoctawColombianColvilleComancheCosta RicanCreeCreekCroatianCrowCubanCypriotCzechCzechoslovakianDanishDelawareDominicanDutchDutch West IndianEastern EuropeanEcuadorianEgyptianEnglishEstonianEthiopianEuropeanFijianFilipinoFinnishFrenchFrench American IndianFrench CanadianGermanGerman RussianGhanaianGreekGuamanian/ChamorroGuatemalanGuyaneseHaitianHmongHonduranHopiHoumaHungarianIcelanderIndian (Asian)IndonesianInupiatIranianIraqiIrishIroquoisIsraeliItalianJamaicanJapaneseJordanianKenyanKiowaKoreanLaotianLatvianLebaneseLiberianLithuanianLumbeeLuxembourgerMacedonianMalaysianMalteseMarshalleseMenomineeMexicanMexican American IndianMongolianMoroccanNative HawaiianNavajoNepaleseNew ZealanderNicaraguanNigerianNorthern EuropeanNorwegianOkinawanOsageOttawaPaiutePakistaniPalestinianPanamanianParaguayanPennsylvania GermanPeruvianPimaPolishPortuguesePotawatomiPuebloPuerto RicanPuget Sound SalishRomanianRussianSalvadoranSamoanScandinavianScotch-IrishScottishSeminoleSenegaleseSerbianShoshoneSierra LeoneanSiouxSlavicSlovakSloveneSomaliSouth AfricanSouth AmericanSouth American IndianSoviet UnionSpaniardSpanishSpanish AmericanSpanish American IndianSri LankanSubsaharan AfricanSudaneseSwedishSwissSyrianTaiwaneseThaiTlingit-HaidaTohono O'OdhamTonganTrinidadian and TobagonianTsimshianTurkishU.S. Virgin IslanderUgandanUkrainianUruguayanUteVenezuelanVietnameseWelshWest IndianYakamaYaquiYugoslavianYumanYup'ikZimbabwean
Immigration
NonimmigrantsImmigrantsAfghanistanAfricaAlbaniaArgentinaArmeniaAsiaAustraliaAustriaBahamasBangladeshBarbadosBelarusBelgiumBelizeBoliviaBosnia and HerzegovinaBrazilBulgariaBurma/MyanmarCabo VerdeCambodiaCameroonCanadaCaribbeanCentral AmericaChileChinaColombiaCongoCosta RicaCroatiaCubaCzechoslovakiaDenmarkDominicaDominican RepublicEastern AfricaEastern AsiaEastern EuropeEcuadorEgyptEl SalvadorEnglandEritreaEthiopiaEuropeFijiFranceGermanyGhanaGreeceGrenadaGuatemalaGuyanaHaitiHondurasHong KongHungaryIndiaIndonesiaIranIraqIrelandIsraelItalyJamaicaJapanJordanKazakhstanKenyaKoreaKuwaitLaosLatin AmericaLatviaLebanonLithuaniaMalaysiaMexicoMicronesiaMiddle AfricaMoldovaMoroccoNepalNetherlandsNicaraguaNigeriaNorth AmericaNorth MacedoniaNorthern AfricaNorthern EuropeNorwayOceaniaPakistanPanamaPeruPhilippinesPolandPortugalRomaniaRussiaSaudi ArabiaScotlandSenegalSerbiaSierra LeoneSingaporeSomaliaSouth AfricaSouth AmericaSouth Central AsiaSouth Eastern AsiaSouthern EuropeSpainSri LankaSt. Vincent and the GrenadinesSudanSwedenSwitzerlandSyriaTaiwanThailandTrinidad and TobagoTurkeyUgandaUkraineUruguayUzbekistanVenezuelaVietnamWest IndiesWestern AfricaWestern AsiaWestern EuropeYemenZaireZimbabweAzores
11th Grade
Income
Poverty
Unemployment
Labor Participation
Family Structure
Vehicle Availability
Education Level
Disability

11th Grade Comparison

Immigrants from Liberia

Immigrants from Burma/Myanmar

Tragic
Tragic
91.9%
11TH GRADE
7.0/ 100
METRIC RATING
221st/ 347
METRIC RANK
90.4%
11TH GRADE
0.0/ 100
METRIC RATING
285th/ 347
METRIC RANK

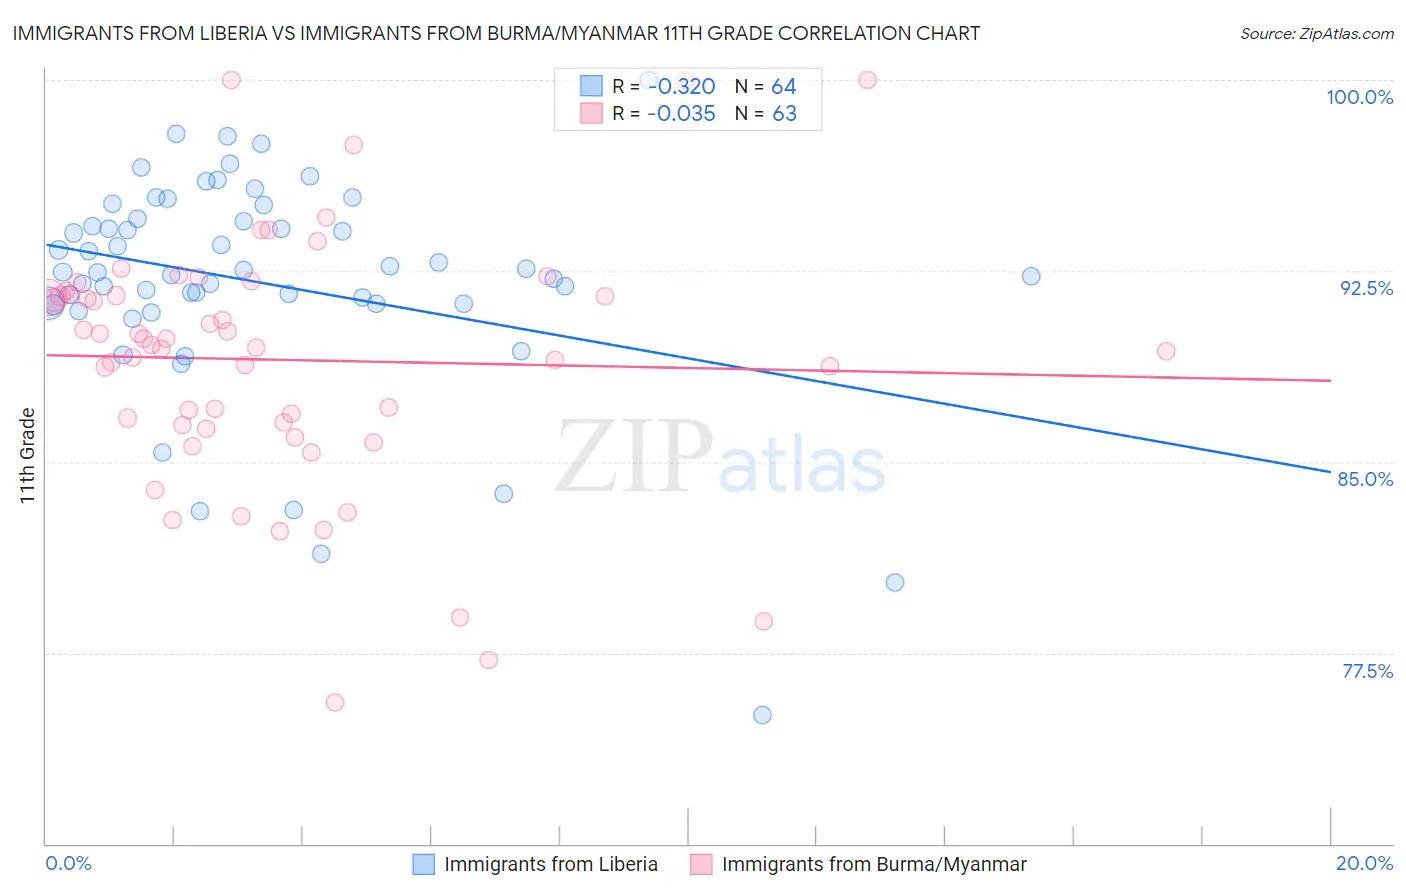
Immigrants from Liberia vs Immigrants from Burma/Myanmar 11th Grade Correlation Chart

The statistical analysis conducted on geographies consisting of 135,293,967 people shows a mild negative correlation between the proportion of Immigrants from Liberia and percentage of population with at least 11th grade education in the United States with a correlation coefficient (R) of -0.320 and weighted average of 91.9%. Similarly, the statistical analysis conducted on geographies consisting of 172,345,696 people shows no correlation between the proportion of Immigrants from Burma/Myanmar and percentage of population with at least 11th grade education in the United States with a correlation coefficient (R) of -0.035 and weighted average of 90.4%, a difference of 1.7%.
Immigrants from Liberia vs Immigrants from Burma/Myanmar 11th Grade

11th Grade Correlation Summary

MeasurementImmigrants from LiberiaImmigrants from Burma/Myanmar
Minimum75.1%75.6%
Maximum100.0%100.0%
Range24.9%24.4%
Mean92.0%89.0%
Median92.4%89.6%
Interquartile 25% (IQ1)91.2%86.4%
Interquartile 75% (IQ3)94.5%91.6%
Interquartile Range (IQR)3.3%5.1%
Standard Deviation (Sample)4.4%4.9%
Standard Deviation (Population)4.4%4.9%

Similar Demographics by 11th Grade

Demographics Similar to Immigrants from Liberia by 11th Grade

In terms of 11th grade, the demographic groups most similar to Immigrants from Liberia are South American Indian (92.0%, a difference of 0.020%), Immigrants from Africa (91.9%, a difference of 0.020%), Immigrants from Bahamas (91.9%, a difference of 0.020%), Costa Rican (91.9%, a difference of 0.030%), and Immigrants from Zaire (91.9%, a difference of 0.070%).
DemographicsRating | Rank11th Grade
Afghans
12.8
/100
|
#214
Poor
92.1%
Immigrants | Southern Europe
12.5
/100
|
#215
Poor
92.1%
Somalis
11.6
/100
|
#216
Poor
92.1%
Immigrants | Sierra Leone
11.1
/100
|
#217
Poor
92.0%
Blackfeet
10.1
/100
|
#218
Poor
92.0%
Portuguese
10.0
/100
|
#219
Tragic
92.0%
South American Indians
7.6
/100
|
#220
Tragic
92.0%
Immigrants | Liberia
7.0
/100
|
#221
Tragic
91.9%
Immigrants | Africa
6.5
/100
|
#222
Tragic
91.9%
Immigrants | Bahamas
6.5
/100
|
#223
Tragic
91.9%
Costa Ricans
6.3
/100
|
#224
Tragic
91.9%
Immigrants | Zaire
5.4
/100
|
#225
Tragic
91.9%
Immigrants | Somalia
5.2
/100
|
#226
Tragic
91.9%
Immigrants | Cameroon
4.4
/100
|
#227
Tragic
91.8%
Immigrants | Panama
4.3
/100
|
#228
Tragic
91.8%

Demographics Similar to Immigrants from Burma/Myanmar by 11th Grade

In terms of 11th grade, the demographic groups most similar to Immigrants from Burma/Myanmar are Immigrants from West Indies (90.4%, a difference of 0.050%), Apache (90.4%, a difference of 0.060%), Pennsylvania German (90.3%, a difference of 0.080%), Immigrants from Laos (90.5%, a difference of 0.090%), and British West Indian (90.3%, a difference of 0.11%).
DemographicsRating | Rank11th Grade
Malaysians
0.1
/100
|
#278
Tragic
90.8%
Barbadians
0.0
/100
|
#279
Tragic
90.8%
Sri Lankans
0.0
/100
|
#280
Tragic
90.7%
Dutch West Indians
0.0
/100
|
#281
Tragic
90.7%
Immigrants | St. Vincent and the Grenadines
0.0
/100
|
#282
Tragic
90.7%
Immigrants | Barbados
0.0
/100
|
#283
Tragic
90.7%
Immigrants | Laos
0.0
/100
|
#284
Tragic
90.5%
Immigrants | Burma/Myanmar
0.0
/100
|
#285
Tragic
90.4%
Immigrants | West Indies
0.0
/100
|
#286
Tragic
90.4%
Apache
0.0
/100
|
#287
Tragic
90.4%
Pennsylvania Germans
0.0
/100
|
#288
Tragic
90.3%
British West Indians
0.0
/100
|
#289
Tragic
90.3%
Indonesians
0.0
/100
|
#290
Tragic
90.3%
Haitians
0.0
/100
|
#291
Tragic
90.3%
Cubans
0.0
/100
|
#292
Tragic
90.2%