Immigrants from Fiji vs English College, Under 1 year

COMPARE

Immigrants from Fiji
Race
Ancestry
AfghanAfricanAlaska NativeAlaskan AthabascanAlbanianAleutAlsatianAmericanApacheArabArapahoArgentineanArmenianAssyrian/Chaldean/SyriacAustralianAustrianBahamianBangladeshiBarbadianBasqueBelgianBelizeanBermudanBhutaneseBlackfeetBolivianBrazilianBritishBritish West IndianBulgarianBurmeseCajunCambodianCanadianCape VerdeanCarpatho RusynCelticCentral AmericanCentral American IndianCherokeeCheyenneChickasawChileanChineseChippewaChoctawColombianColvilleComancheCosta RicanCreeCreekCroatianCrowCubanCypriotCzechCzechoslovakianDanishDelawareDominicanDutchDutch West IndianEastern EuropeanEcuadorianEgyptianEstonianEthiopianEuropeanFijianFilipinoFinnishFrenchFrench American IndianFrench CanadianGermanGerman RussianGhanaianGreekGuamanian/ChamorroGuatemalanGuyaneseHaitianHmongHonduranHopiHoumaHungarianIcelanderIndian (Asian)IndonesianInupiatIranianIraqiIrishIroquoisIsraeliItalianJamaicanJapaneseJordanianKenyanKiowaKoreanLaotianLatvianLebaneseLiberianLithuanianLumbeeLuxembourgerMacedonianMalaysianMalteseMarshalleseMenomineeMexicanMexican American IndianMongolianMoroccanNative HawaiianNavajoNepaleseNew ZealanderNicaraguanNigerianNorthern EuropeanNorwegianOkinawanOsageOttawaPaiutePakistaniPalestinianPanamanianParaguayanPennsylvania GermanPeruvianPimaPolishPortuguesePotawatomiPuebloPuerto RicanPuget Sound SalishRomanianRussianSalvadoranSamoanScandinavianScotch-IrishScottishSeminoleSenegaleseSerbianShoshoneSierra LeoneanSiouxSlavicSlovakSloveneSomaliSouth AfricanSouth AmericanSouth American IndianSoviet UnionSpaniardSpanishSpanish AmericanSpanish American IndianSri LankanSubsaharan AfricanSudaneseSwedishSwissSyrianTaiwaneseThaiTlingit-HaidaTohono O'OdhamTonganTrinidadian and TobagonianTsimshianTurkishU.S. Virgin IslanderUgandanUkrainianUruguayanUteVenezuelanVietnameseWelshWest IndianYakamaYaquiYugoslavianYumanYup'ikZimbabwean
Immigration
NonimmigrantsImmigrantsAfghanistanAfricaAlbaniaArgentinaArmeniaAsiaAustraliaAustriaBahamasBangladeshBarbadosBelarusBelgiumBelizeBoliviaBosnia and HerzegovinaBrazilBulgariaBurma/MyanmarCabo VerdeCambodiaCameroonCanadaCaribbeanCentral AmericaChileChinaColombiaCongoCosta RicaCroatiaCubaCzechoslovakiaDenmarkDominicaDominican RepublicEastern AfricaEastern AsiaEastern EuropeEcuadorEgyptEl SalvadorEnglandEritreaEthiopiaEuropeFijiFranceGermanyGhanaGreeceGrenadaGuatemalaGuyanaHaitiHondurasHong KongHungaryIndiaIndonesiaIranIraqIrelandIsraelItalyJamaicaJapanJordanKazakhstanKenyaKoreaKuwaitLaosLatin AmericaLatviaLebanonLiberiaLithuaniaMalaysiaMexicoMicronesiaMiddle AfricaMoldovaMoroccoNepalNetherlandsNicaraguaNigeriaNorth AmericaNorth MacedoniaNorthern AfricaNorthern EuropeNorwayOceaniaPakistanPanamaPeruPhilippinesPolandPortugalRomaniaRussiaSaudi ArabiaScotlandSenegalSerbiaSierra LeoneSingaporeSomaliaSouth AfricaSouth AmericaSouth Central AsiaSouth Eastern AsiaSouthern EuropeSpainSri LankaSt. Vincent and the GrenadinesSudanSwedenSwitzerlandSyriaTaiwanThailandTrinidad and TobagoTurkeyUgandaUkraineUruguayUzbekistanVenezuelaVietnamWest IndiesWestern AfricaWestern AsiaWestern EuropeYemenZaireZimbabweAzores
English
Race
Ancestry
AfghanAfricanAlaska NativeAlaskan AthabascanAlbanianAleutAlsatianAmericanApacheArabArapahoArgentineanArmenianAssyrian/Chaldean/SyriacAustralianAustrianBahamianBangladeshiBarbadianBasqueBelgianBelizeanBermudanBhutaneseBlackfeetBolivianBrazilianBritishBritish West IndianBulgarianBurmeseCajunCambodianCanadianCape VerdeanCarpatho RusynCelticCentral AmericanCentral American IndianCherokeeCheyenneChickasawChileanChineseChippewaChoctawColombianColvilleComancheCosta RicanCreeCreekCroatianCrowCubanCypriotCzechCzechoslovakianDanishDelawareDominicanDutchDutch West IndianEastern EuropeanEcuadorianEgyptianEnglishEstonianEthiopianEuropeanFijianFilipinoFinnishFrenchFrench American IndianFrench CanadianGermanGerman RussianGhanaianGreekGuamanian/ChamorroGuatemalanGuyaneseHaitianHmongHonduranHopiHoumaHungarianIcelanderIndian (Asian)IndonesianInupiatIranianIraqiIrishIroquoisIsraeliItalianJamaicanJapaneseJordanianKenyanKiowaKoreanLaotianLatvianLebaneseLiberianLithuanianLumbeeLuxembourgerMacedonianMalaysianMalteseMarshalleseMenomineeMexicanMexican American IndianMongolianMoroccanNative HawaiianNavajoNepaleseNew ZealanderNicaraguanNigerianNorthern EuropeanNorwegianOkinawanOsageOttawaPaiutePakistaniPalestinianPanamanianParaguayanPennsylvania GermanPeruvianPimaPolishPortuguesePotawatomiPuebloPuerto RicanPuget Sound SalishRomanianRussianSalvadoranSamoanScandinavianScotch-IrishScottishSeminoleSenegaleseSerbianShoshoneSierra LeoneanSiouxSlavicSlovakSloveneSomaliSouth AfricanSouth AmericanSouth American IndianSoviet UnionSpaniardSpanishSpanish AmericanSpanish American IndianSri LankanSubsaharan AfricanSudaneseSwedishSwissSyrianTaiwaneseThaiTlingit-HaidaTohono O'OdhamTonganTrinidadian and TobagonianTsimshianTurkishU.S. Virgin IslanderUgandanUkrainianUruguayanUteVenezuelanVietnameseWelshWest IndianYakamaYaquiYugoslavianYumanYup'ikZimbabwean
Immigration
NonimmigrantsImmigrantsAfghanistanAfricaAlbaniaArgentinaArmeniaAsiaAustraliaAustriaBahamasBangladeshBarbadosBelarusBelgiumBelizeBoliviaBosnia and HerzegovinaBrazilBulgariaBurma/MyanmarCabo VerdeCambodiaCameroonCanadaCaribbeanCentral AmericaChileChinaColombiaCongoCosta RicaCroatiaCubaCzechoslovakiaDenmarkDominicaDominican RepublicEastern AfricaEastern AsiaEastern EuropeEcuadorEgyptEl SalvadorEnglandEritreaEthiopiaEuropeFranceGermanyGhanaGreeceGrenadaGuatemalaGuyanaHaitiHondurasHong KongHungaryIndiaIndonesiaIranIraqIrelandIsraelItalyJamaicaJapanJordanKazakhstanKenyaKoreaKuwaitLaosLatin AmericaLatviaLebanonLiberiaLithuaniaMalaysiaMexicoMicronesiaMiddle AfricaMoldovaMoroccoNepalNetherlandsNicaraguaNigeriaNorth AmericaNorth MacedoniaNorthern AfricaNorthern EuropeNorwayOceaniaPakistanPanamaPeruPhilippinesPolandPortugalRomaniaRussiaSaudi ArabiaScotlandSenegalSerbiaSierra LeoneSingaporeSomaliaSouth AfricaSouth AmericaSouth Central AsiaSouth Eastern AsiaSouthern EuropeSpainSri LankaSt. Vincent and the GrenadinesSudanSwedenSwitzerlandSyriaTaiwanThailandTrinidad and TobagoTurkeyUgandaUkraineUruguayUzbekistanVenezuelaVietnamWest IndiesWestern AfricaWestern AsiaWestern EuropeYemenZaireZimbabweAzores
College, Under 1 year
Income
Poverty
Unemployment
Labor Participation
Family Structure
Vehicle Availability
Education Level
Disability

College, Under 1 year Comparison

Immigrants from Fiji

English

Tragic
Excellent
63.4%
COLLEGE, UNDER 1 YEAR
5.7/ 100
METRIC RATING
219th/ 347
METRIC RANK
66.6%
COLLEGE, UNDER 1 YEAR
82.9/ 100
METRIC RATING
142nd/ 347
METRIC RANK

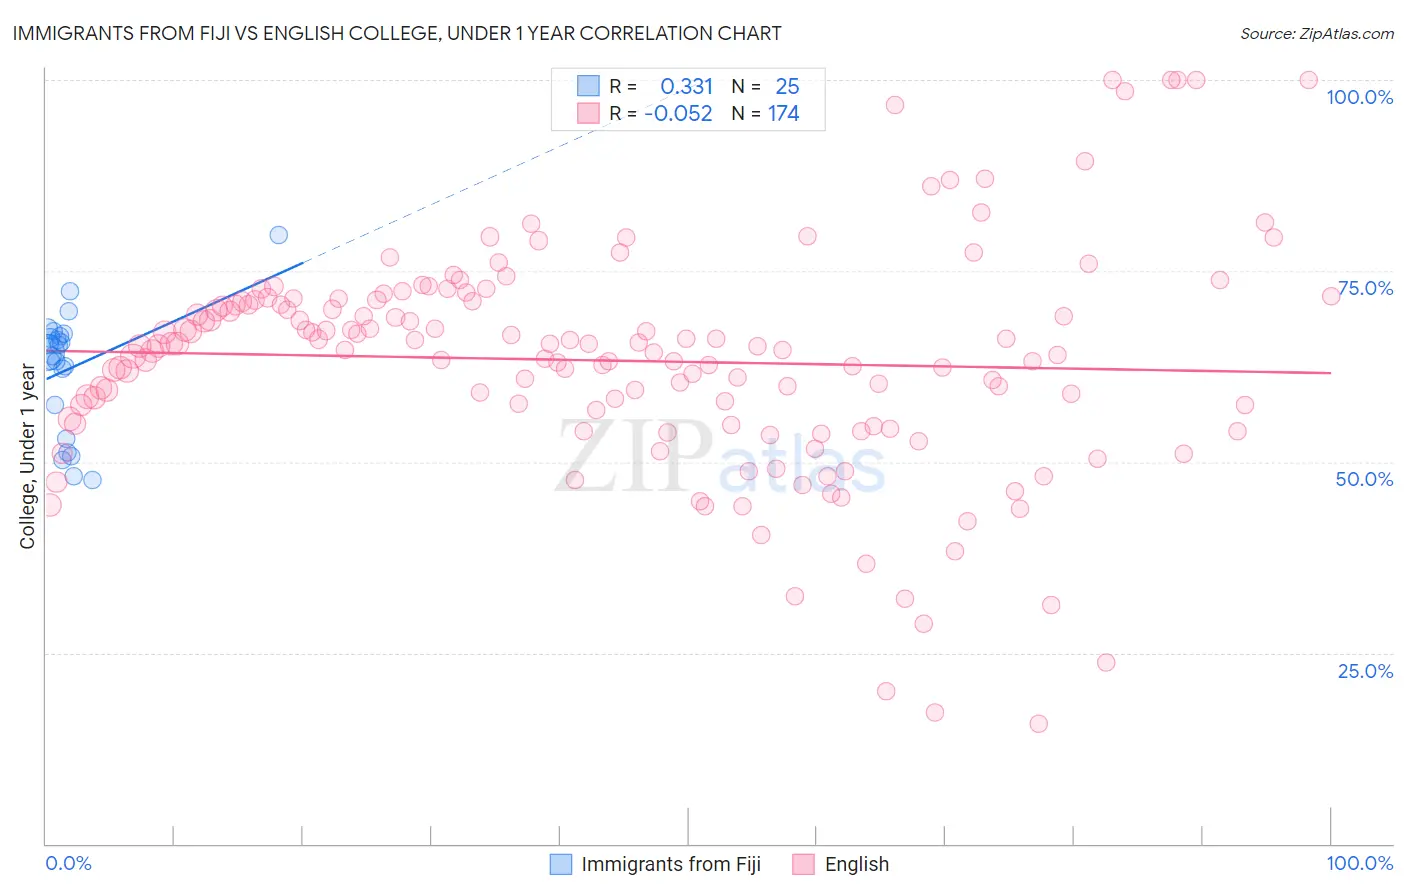
Immigrants from Fiji vs English College, Under 1 year Correlation Chart

The statistical analysis conducted on geographies consisting of 93,755,737 people shows a mild positive correlation between the proportion of Immigrants from Fiji and percentage of population with at least college, under 1 year education in the United States with a correlation coefficient (R) of 0.331 and weighted average of 63.4%. Similarly, the statistical analysis conducted on geographies consisting of 579,966,424 people shows a slight negative correlation between the proportion of English and percentage of population with at least college, under 1 year education in the United States with a correlation coefficient (R) of -0.052 and weighted average of 66.6%, a difference of 5.0%.
Immigrants from Fiji vs English College, Under 1 year

College, Under 1 year Correlation Summary

MeasurementImmigrants from FijiEnglish
Minimum47.6%15.7%
Maximum79.8%100.0%
Range32.2%84.3%
Mean62.2%63.3%
Median64.3%64.9%
Interquartile 25% (IQ1)55.2%55.0%
Interquartile 75% (IQ3)66.6%71.0%
Interquartile Range (IQR)11.3%16.0%
Standard Deviation (Sample)8.0%14.9%
Standard Deviation (Population)7.9%14.8%

Similar Demographics by College, Under 1 year

Demographics Similar to Immigrants from Fiji by College, Under 1 year

In terms of college, under 1 year, the demographic groups most similar to Immigrants from Fiji are Immigrants from Panama (63.4%, a difference of 0.010%), Portuguese (63.4%, a difference of 0.020%), Immigrants from Uruguay (63.4%, a difference of 0.030%), Cree (63.3%, a difference of 0.11%), and Immigrants from Senegal (63.3%, a difference of 0.16%).
DemographicsRating | RankCollege, Under 1 year
Immigrants | Middle Africa
10.5
/100
|
#212
Poor
63.9%
Immigrants | South America
9.1
/100
|
#213
Tragic
63.8%
Immigrants | Nigeria
8.8
/100
|
#214
Tragic
63.7%
Senegalese
7.7
/100
|
#215
Tragic
63.6%
Hmong
6.8
/100
|
#216
Tragic
63.5%
Immigrants | Uruguay
5.8
/100
|
#217
Tragic
63.4%
Immigrants | Panama
5.7
/100
|
#218
Tragic
63.4%
Immigrants | Fiji
5.7
/100
|
#219
Tragic
63.4%
Portuguese
5.6
/100
|
#220
Tragic
63.4%
Cree
5.2
/100
|
#221
Tragic
63.3%
Immigrants | Senegal
5.0
/100
|
#222
Tragic
63.3%
Immigrants | Costa Rica
4.5
/100
|
#223
Tragic
63.2%
Sub-Saharan Africans
4.4
/100
|
#224
Tragic
63.2%
Immigrants | Peru
4.0
/100
|
#225
Tragic
63.1%
Immigrants | Colombia
4.0
/100
|
#226
Tragic
63.1%

Demographics Similar to English by College, Under 1 year

In terms of college, under 1 year, the demographic groups most similar to English are Immigrants from Uganda (66.5%, a difference of 0.010%), Immigrants from Germany (66.5%, a difference of 0.070%), Immigrants from Kenya (66.5%, a difference of 0.090%), Kenyan (66.5%, a difference of 0.090%), and Immigrants from Morocco (66.5%, a difference of 0.090%).
DemographicsRating | RankCollege, Under 1 year
Canadians
87.9
/100
|
#135
Excellent
66.8%
Ugandans
87.8
/100
|
#136
Excellent
66.8%
Immigrants | Chile
87.4
/100
|
#137
Excellent
66.8%
Immigrants | Italy
86.9
/100
|
#138
Excellent
66.8%
Venezuelans
85.9
/100
|
#139
Excellent
66.7%
Slavs
85.9
/100
|
#140
Excellent
66.7%
Immigrants | Afghanistan
85.1
/100
|
#141
Excellent
66.7%
English
82.9
/100
|
#142
Excellent
66.6%
Immigrants | Uganda
82.8
/100
|
#143
Excellent
66.5%
Immigrants | Germany
82.0
/100
|
#144
Excellent
66.5%
Immigrants | Kenya
81.8
/100
|
#145
Excellent
66.5%
Kenyans
81.7
/100
|
#146
Excellent
66.5%
Immigrants | Morocco
81.7
/100
|
#147
Excellent
66.5%
Taiwanese
78.6
/100
|
#148
Good
66.4%
Immigrants | Venezuela
77.9
/100
|
#149
Good
66.3%