Immigrants from England vs Immigrants from Brazil 3rd Grade

COMPARE

Immigrants from England
Race
Ancestry
AfghanAfricanAlaska NativeAlaskan AthabascanAlbanianAleutAlsatianAmericanApacheArabArapahoArgentineanArmenianAssyrian/Chaldean/SyriacAustralianAustrianBahamianBangladeshiBarbadianBasqueBelgianBelizeanBermudanBhutaneseBlackfeetBolivianBrazilianBritishBritish West IndianBulgarianBurmeseCajunCambodianCanadianCape VerdeanCarpatho RusynCelticCentral AmericanCentral American IndianCherokeeCheyenneChickasawChileanChineseChippewaChoctawColombianColvilleComancheCosta RicanCreeCreekCroatianCrowCubanCypriotCzechCzechoslovakianDanishDelawareDominicanDutchDutch West IndianEastern EuropeanEcuadorianEgyptianEnglishEstonianEthiopianEuropeanFijianFilipinoFinnishFrenchFrench American IndianFrench CanadianGermanGerman RussianGhanaianGreekGuamanian/ChamorroGuatemalanGuyaneseHaitianHmongHonduranHopiHoumaHungarianIcelanderIndian (Asian)IndonesianInupiatIranianIraqiIrishIroquoisIsraeliItalianJamaicanJapaneseJordanianKenyanKiowaKoreanLaotianLatvianLebaneseLiberianLithuanianLumbeeLuxembourgerMacedonianMalaysianMalteseMarshalleseMenomineeMexicanMexican American IndianMongolianMoroccanNative HawaiianNavajoNepaleseNew ZealanderNicaraguanNigerianNorthern EuropeanNorwegianOkinawanOsageOttawaPaiutePakistaniPalestinianPanamanianParaguayanPennsylvania GermanPeruvianPimaPolishPortuguesePotawatomiPuebloPuerto RicanPuget Sound SalishRomanianRussianSalvadoranSamoanScandinavianScotch-IrishScottishSeminoleSenegaleseSerbianShoshoneSierra LeoneanSiouxSlavicSlovakSloveneSomaliSouth AfricanSouth AmericanSouth American IndianSoviet UnionSpaniardSpanishSpanish AmericanSpanish American IndianSri LankanSubsaharan AfricanSudaneseSwedishSwissSyrianTaiwaneseThaiTlingit-HaidaTohono O'OdhamTonganTrinidadian and TobagonianTsimshianTurkishU.S. Virgin IslanderUgandanUkrainianUruguayanUteVenezuelanVietnameseWelshWest IndianYakamaYaquiYugoslavianYumanYup'ikZimbabwean
Immigration
NonimmigrantsImmigrantsAfghanistanAfricaAlbaniaArgentinaArmeniaAsiaAustraliaAustriaBahamasBangladeshBarbadosBelarusBelgiumBelizeBoliviaBosnia and HerzegovinaBulgariaBurma/MyanmarCabo VerdeCambodiaCameroonCanadaCaribbeanCentral AmericaChileChinaColombiaCongoCosta RicaCroatiaCubaCzechoslovakiaDenmarkDominicaDominican RepublicEastern AfricaEastern AsiaEastern EuropeEcuadorEgyptEl SalvadorEnglandEritreaEthiopiaEuropeFijiFranceGermanyGhanaGreeceGrenadaGuatemalaGuyanaHaitiHondurasHong KongHungaryIndiaIndonesiaIranIraqIrelandIsraelItalyJamaicaJapanJordanKazakhstanKenyaKoreaKuwaitLaosLatin AmericaLatviaLebanonLiberiaLithuaniaMalaysiaMexicoMicronesiaMiddle AfricaMoldovaMoroccoNepalNetherlandsNicaraguaNigeriaNorth AmericaNorth MacedoniaNorthern AfricaNorthern EuropeNorwayOceaniaPakistanPanamaPeruPhilippinesPolandPortugalRomaniaRussiaSaudi ArabiaScotlandSenegalSerbiaSierra LeoneSingaporeSomaliaSouth AfricaSouth AmericaSouth Central AsiaSouth Eastern AsiaSouthern EuropeSpainSri LankaSt. Vincent and the GrenadinesSudanSwedenSwitzerlandSyriaTaiwanThailandTrinidad and TobagoTurkeyUgandaUkraineUruguayUzbekistanVenezuelaVietnamWest IndiesWestern AfricaWestern AsiaWestern EuropeYemenZaireZimbabweAzores
Immigrants from Brazil
Race
Ancestry
AfghanAfricanAlaska NativeAlaskan AthabascanAlbanianAleutAlsatianAmericanApacheArabArapahoArgentineanArmenianAssyrian/Chaldean/SyriacAustralianAustrianBahamianBangladeshiBarbadianBasqueBelgianBelizeanBermudanBhutaneseBlackfeetBolivianBrazilianBritishBritish West IndianBulgarianBurmeseCajunCambodianCanadianCape VerdeanCarpatho RusynCelticCentral AmericanCentral American IndianCherokeeCheyenneChickasawChileanChineseChippewaChoctawColombianColvilleComancheCosta RicanCreeCreekCroatianCrowCubanCypriotCzechCzechoslovakianDanishDelawareDominicanDutchDutch West IndianEastern EuropeanEcuadorianEgyptianEnglishEstonianEthiopianEuropeanFijianFilipinoFinnishFrenchFrench American IndianFrench CanadianGermanGerman RussianGhanaianGreekGuamanian/ChamorroGuatemalanGuyaneseHaitianHmongHonduranHopiHoumaHungarianIcelanderIndian (Asian)IndonesianInupiatIranianIraqiIrishIroquoisIsraeliItalianJamaicanJapaneseJordanianKenyanKiowaKoreanLaotianLatvianLebaneseLiberianLithuanianLumbeeLuxembourgerMacedonianMalaysianMalteseMarshalleseMenomineeMexicanMexican American IndianMongolianMoroccanNative HawaiianNavajoNepaleseNew ZealanderNicaraguanNigerianNorthern EuropeanNorwegianOkinawanOsageOttawaPaiutePakistaniPalestinianPanamanianParaguayanPennsylvania GermanPeruvianPimaPolishPortuguesePotawatomiPuebloPuerto RicanPuget Sound SalishRomanianRussianSalvadoranSamoanScandinavianScotch-IrishScottishSeminoleSenegaleseSerbianShoshoneSierra LeoneanSiouxSlavicSlovakSloveneSomaliSouth AfricanSouth AmericanSouth American IndianSoviet UnionSpaniardSpanishSpanish AmericanSpanish American IndianSri LankanSubsaharan AfricanSudaneseSwedishSwissSyrianTaiwaneseThaiTlingit-HaidaTohono O'OdhamTonganTrinidadian and TobagonianTsimshianTurkishU.S. Virgin IslanderUgandanUkrainianUruguayanUteVenezuelanVietnameseWelshWest IndianYakamaYaquiYugoslavianYumanYup'ikZimbabwean
Immigration
NonimmigrantsImmigrantsAfghanistanAfricaAlbaniaArgentinaArmeniaAsiaAustraliaAustriaBahamasBangladeshBarbadosBelarusBelgiumBelizeBoliviaBosnia and HerzegovinaBrazilBulgariaBurma/MyanmarCabo VerdeCambodiaCameroonCanadaCaribbeanCentral AmericaChileChinaColombiaCongoCosta RicaCroatiaCubaCzechoslovakiaDenmarkDominicaDominican RepublicEastern AfricaEastern AsiaEastern EuropeEcuadorEgyptEl SalvadorEritreaEthiopiaEuropeFijiFranceGermanyGhanaGreeceGrenadaGuatemalaGuyanaHaitiHondurasHong KongHungaryIndiaIndonesiaIranIraqIrelandIsraelItalyJamaicaJapanJordanKazakhstanKenyaKoreaKuwaitLaosLatin AmericaLatviaLebanonLiberiaLithuaniaMalaysiaMexicoMicronesiaMiddle AfricaMoldovaMoroccoNepalNetherlandsNicaraguaNigeriaNorth AmericaNorth MacedoniaNorthern AfricaNorthern EuropeNorwayOceaniaPakistanPanamaPeruPhilippinesPolandPortugalRomaniaRussiaSaudi ArabiaScotlandSenegalSerbiaSierra LeoneSingaporeSomaliaSouth AfricaSouth AmericaSouth Central AsiaSouth Eastern AsiaSouthern EuropeSpainSri LankaSt. Vincent and the GrenadinesSudanSwedenSwitzerlandSyriaTaiwanThailandTrinidad and TobagoTurkeyUgandaUkraineUruguayUzbekistanVenezuelaVietnamWest IndiesWestern AfricaWestern AsiaWestern EuropeYemenZaireZimbabweAzores
3rd Grade
Income
Poverty
Unemployment
Labor Participation
Family Structure
Vehicle Availability
Education Level
Disability

3rd Grade Comparison

Immigrants from England

Immigrants from Brazil

Exceptional
Average
98.2%
3RD GRADE
99.2/ 100
METRIC RATING
76th/ 347
METRIC RANK
97.7%
3RD GRADE
46.4/ 100
METRIC RATING
178th/ 347
METRIC RANK

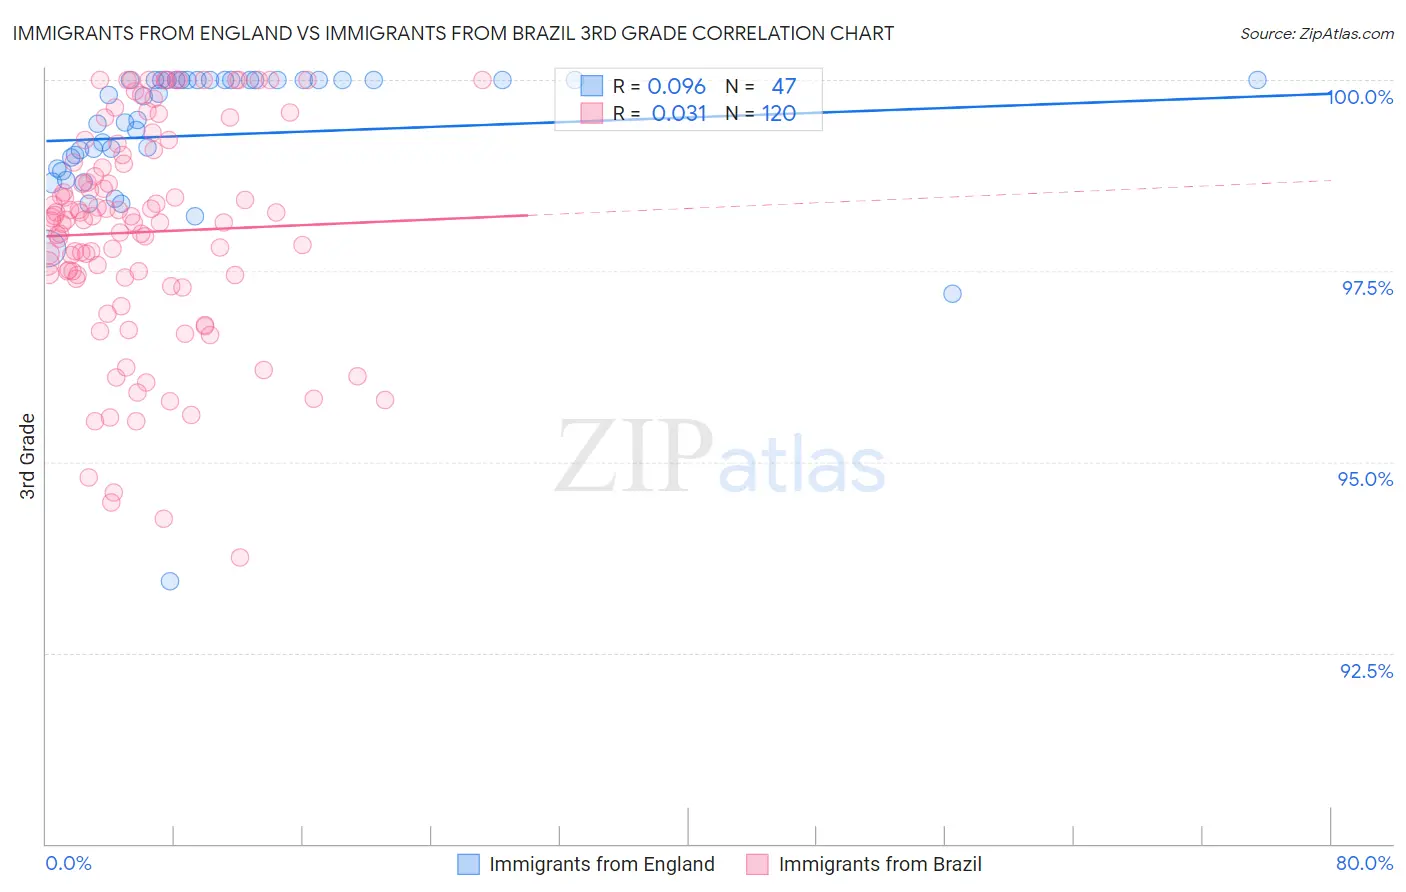
Immigrants from England vs Immigrants from Brazil 3rd Grade Correlation Chart

The statistical analysis conducted on geographies consisting of 391,898,018 people shows a slight positive correlation between the proportion of Immigrants from England and percentage of population with at least 3rd grade education in the United States with a correlation coefficient (R) of 0.096 and weighted average of 98.2%. Similarly, the statistical analysis conducted on geographies consisting of 343,021,580 people shows no correlation between the proportion of Immigrants from Brazil and percentage of population with at least 3rd grade education in the United States with a correlation coefficient (R) of 0.031 and weighted average of 97.7%, a difference of 0.43%.
Immigrants from England vs Immigrants from Brazil 3rd Grade

3rd Grade Correlation Summary

MeasurementImmigrants from EnglandImmigrants from Brazil
Minimum93.4%93.7%
Maximum100.0%100.0%
Range6.6%6.3%
Mean99.3%98.0%
Median99.8%98.2%
Interquartile 25% (IQ1)98.8%97.4%
Interquartile 75% (IQ3)100.0%99.0%
Interquartile Range (IQR)1.2%1.5%
Standard Deviation (Sample)1.1%1.4%
Standard Deviation (Population)1.1%1.4%

Similar Demographics by 3rd Grade

Demographics Similar to Immigrants from England by 3rd Grade

In terms of 3rd grade, the demographic groups most similar to Immigrants from England are Immigrants from Netherlands (98.2%, a difference of 0.0%), Cherokee (98.2%, a difference of 0.0%), Immigrants from Lithuania (98.2%, a difference of 0.0%), Cheyenne (98.2%, a difference of 0.010%), and Osage (98.2%, a difference of 0.010%).
DemographicsRating | Rank3rd Grade
Canadians
99.6
/100
|
#69
Exceptional
98.2%
Cajuns
99.6
/100
|
#70
Exceptional
98.2%
Immigrants | Austria
99.6
/100
|
#71
Exceptional
98.2%
Chickasaw
99.5
/100
|
#72
Exceptional
98.2%
Cheyenne
99.3
/100
|
#73
Exceptional
98.2%
Immigrants | Netherlands
99.3
/100
|
#74
Exceptional
98.2%
Cherokee
99.3
/100
|
#75
Exceptional
98.2%
Immigrants | England
99.2
/100
|
#76
Exceptional
98.2%
Immigrants | Lithuania
99.2
/100
|
#77
Exceptional
98.2%
Osage
99.2
/100
|
#78
Exceptional
98.2%
Immigrants | Belgium
99.1
/100
|
#79
Exceptional
98.1%
Macedonians
99.1
/100
|
#80
Exceptional
98.1%
Icelanders
99.1
/100
|
#81
Exceptional
98.1%
Shoshone
99.0
/100
|
#82
Exceptional
98.1%
Ukrainians
98.9
/100
|
#83
Exceptional
98.1%

Demographics Similar to Immigrants from Brazil by 3rd Grade

In terms of 3rd grade, the demographic groups most similar to Immigrants from Brazil are Immigrants from Micronesia (97.8%, a difference of 0.0%), Immigrants from Poland (97.8%, a difference of 0.0%), Egyptian (97.7%, a difference of 0.0%), Immigrants from Belarus (97.7%, a difference of 0.0%), and Immigrants from Sri Lanka (97.7%, a difference of 0.0%).
DemographicsRating | Rank3rd Grade
Kenyans
51.8
/100
|
#171
Average
97.8%
Spanish Americans
51.8
/100
|
#172
Average
97.8%
Immigrants | Korea
50.9
/100
|
#173
Average
97.8%
Navajo
50.0
/100
|
#174
Average
97.8%
Immigrants | Micronesia
47.6
/100
|
#175
Average
97.8%
Immigrants | Poland
47.1
/100
|
#176
Average
97.8%
Egyptians
46.6
/100
|
#177
Average
97.7%
Immigrants | Brazil
46.4
/100
|
#178
Average
97.7%
Immigrants | Belarus
45.9
/100
|
#179
Average
97.7%
Immigrants | Sri Lanka
45.1
/100
|
#180
Average
97.7%
Immigrants | Venezuela
44.4
/100
|
#181
Average
97.7%
Argentineans
42.9
/100
|
#182
Average
97.7%
Arabs
40.0
/100
|
#183
Fair
97.7%
Immigrants | Kazakhstan
37.4
/100
|
#184
Fair
97.7%
Immigrants | Argentina
37.0
/100
|
#185
Fair
97.7%