Immigrants from Egypt vs Sri Lankan Associate's Degree
COMPARE
Immigrants from Egypt
Sri Lankan
Associate's Degree
Associate's Degree Comparison
Immigrants from Egypt
Sri Lankans
50.2%
ASSOCIATE'S DEGREE
98.9/ 100
METRIC RATING
85th/ 347
METRIC RANK
46.3%
ASSOCIATE'S DEGREE
47.6/ 100
METRIC RATING
179th/ 347
METRIC RANK
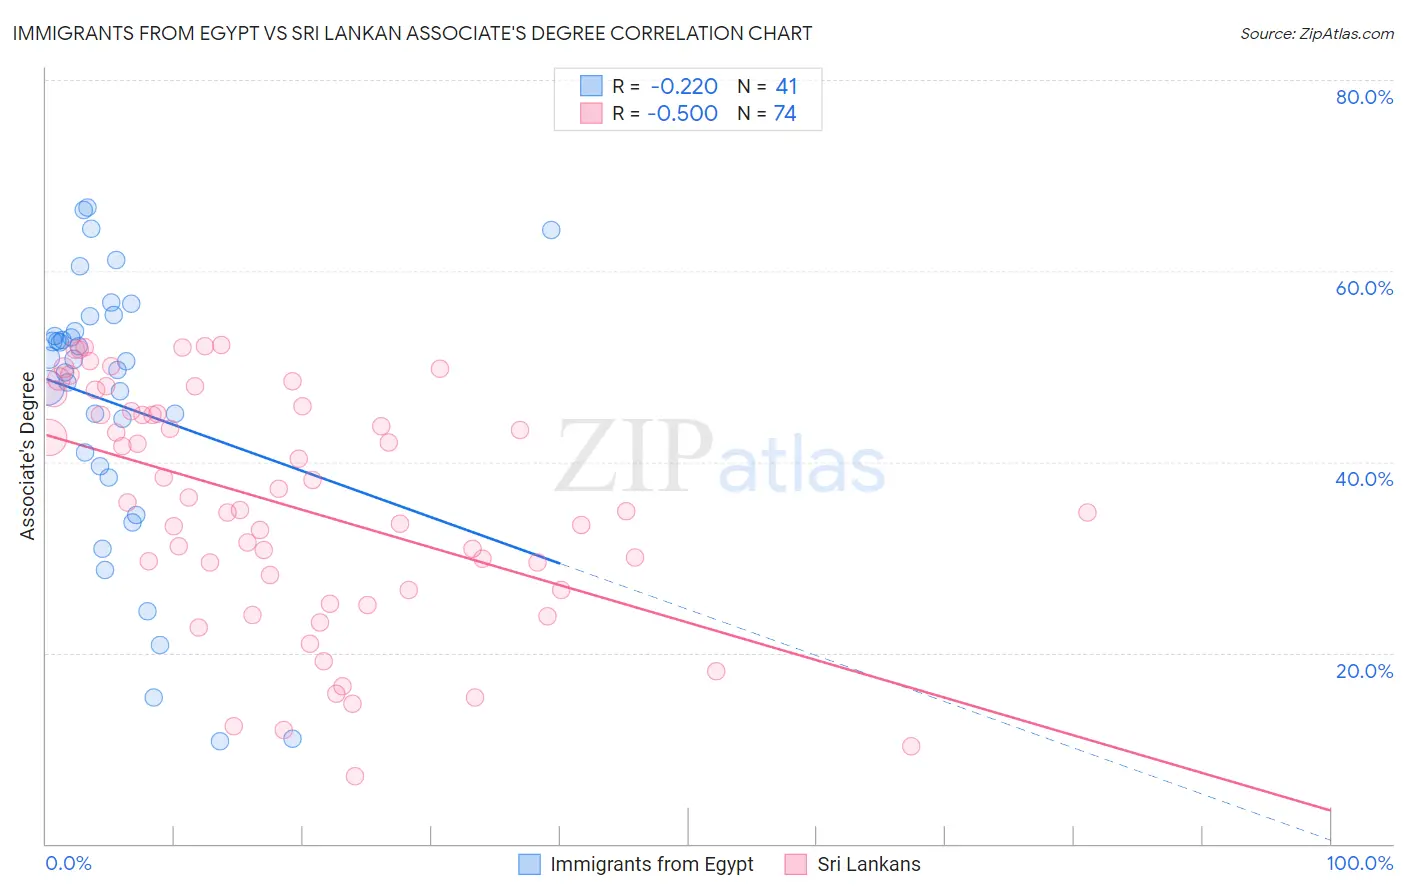
Immigrants from Egypt vs Sri Lankan Associate's Degree Correlation Chart
The statistical analysis conducted on geographies consisting of 245,484,715 people shows a weak negative correlation between the proportion of Immigrants from Egypt and percentage of population with at least associate's degree education in the United States with a correlation coefficient (R) of -0.220 and weighted average of 50.2%. Similarly, the statistical analysis conducted on geographies consisting of 440,543,286 people shows a substantial negative correlation between the proportion of Sri Lankans and percentage of population with at least associate's degree education in the United States with a correlation coefficient (R) of -0.500 and weighted average of 46.3%, a difference of 8.6%.
Associate's Degree Correlation Summary
| Measurement | Immigrants from Egypt | Sri Lankan |
| Minimum | 10.8% | 7.0% |
| Maximum | 66.7% | 52.3% |
| Range | 55.9% | 45.3% |
| Mean | 46.0% | 35.4% |
| Median | 50.5% | 35.3% |
| Interquartile 25% (IQ1) | 38.9% | 26.6% |
| Interquartile 75% (IQ3) | 54.4% | 45.3% |
| Interquartile Range (IQR) | 15.5% | 18.7% |
| Standard Deviation (Sample) | 14.4% | 12.2% |
| Standard Deviation (Population) | 14.2% | 12.1% |
Similar Demographics by Associate's Degree
Demographics Similar to Immigrants from Egypt by Associate's Degree
In terms of associate's degree, the demographic groups most similar to Immigrants from Egypt are Immigrants from Croatia (50.2%, a difference of 0.010%), Immigrants from Hungary (50.2%, a difference of 0.050%), Immigrants from Uzbekistan (50.3%, a difference of 0.070%), Greek (50.3%, a difference of 0.11%), and Immigrants from Moldova (50.2%, a difference of 0.13%).
| Demographics | Rating | Rank | Associate's Degree |
| Immigrants | Eastern Europe | 99.1 /100 | #78 | Exceptional 50.5% |
| Ethiopians | 99.1 /100 | #79 | Exceptional 50.4% |
| Armenians | 99.1 /100 | #80 | Exceptional 50.4% |
| Maltese | 99.1 /100 | #81 | Exceptional 50.4% |
| Greeks | 98.9 /100 | #82 | Exceptional 50.3% |
| Immigrants | Uzbekistan | 98.9 /100 | #83 | Exceptional 50.3% |
| Immigrants | Hungary | 98.9 /100 | #84 | Exceptional 50.2% |
| Immigrants | Egypt | 98.9 /100 | #85 | Exceptional 50.2% |
| Immigrants | Croatia | 98.9 /100 | #86 | Exceptional 50.2% |
| Immigrants | Moldova | 98.8 /100 | #87 | Exceptional 50.2% |
| Immigrants | Canada | 98.7 /100 | #88 | Exceptional 50.1% |
| Immigrants | Western Europe | 98.7 /100 | #89 | Exceptional 50.1% |
| Immigrants | Ethiopia | 98.7 /100 | #90 | Exceptional 50.1% |
| Immigrants | Western Asia | 98.7 /100 | #91 | Exceptional 50.1% |
| Immigrants | North America | 98.7 /100 | #92 | Exceptional 50.1% |
Demographics Similar to Sri Lankans by Associate's Degree
In terms of associate's degree, the demographic groups most similar to Sri Lankans are Immigrants from Bosnia and Herzegovina (46.3%, a difference of 0.050%), Slovak (46.3%, a difference of 0.060%), Finnish (46.3%, a difference of 0.070%), Bermudan (46.2%, a difference of 0.090%), and Belgian (46.3%, a difference of 0.10%).
| Demographics | Rating | Rank | Associate's Degree |
| Peruvians | 50.5 /100 | #172 | Average 46.4% |
| Immigrants | Iraq | 50.3 /100 | #173 | Average 46.4% |
| English | 50.0 /100 | #174 | Average 46.4% |
| Belgians | 48.9 /100 | #175 | Average 46.3% |
| Finns | 48.5 /100 | #176 | Average 46.3% |
| Slovaks | 48.4 /100 | #177 | Average 46.3% |
| Immigrants | Bosnia and Herzegovina | 48.3 /100 | #178 | Average 46.3% |
| Sri Lankans | 47.6 /100 | #179 | Average 46.3% |
| Bermudans | 46.4 /100 | #180 | Average 46.2% |
| Immigrants | Colombia | 41.3 /100 | #181 | Average 46.0% |
| Swiss | 40.4 /100 | #182 | Average 46.0% |
| Yugoslavians | 40.2 /100 | #183 | Average 46.0% |
| Czechoslovakians | 40.0 /100 | #184 | Average 46.0% |
| Costa Ricans | 38.6 /100 | #185 | Fair 46.0% |
| Welsh | 37.9 /100 | #186 | Fair 45.9% |