Immigrants from Cambodia vs Immigrants from China 3rd Grade

COMPARE

Immigrants from Cambodia
Race
Ancestry
AfghanAfricanAlaska NativeAlaskan AthabascanAlbanianAleutAlsatianAmericanApacheArabArapahoArgentineanArmenianAssyrian/Chaldean/SyriacAustralianAustrianBahamianBangladeshiBarbadianBasqueBelgianBelizeanBermudanBhutaneseBlackfeetBolivianBrazilianBritishBritish West IndianBulgarianBurmeseCajunCambodianCanadianCape VerdeanCarpatho RusynCelticCentral AmericanCentral American IndianCherokeeCheyenneChickasawChileanChineseChippewaChoctawColombianColvilleComancheCosta RicanCreeCreekCroatianCrowCubanCypriotCzechCzechoslovakianDanishDelawareDominicanDutchDutch West IndianEastern EuropeanEcuadorianEgyptianEnglishEstonianEthiopianEuropeanFijianFilipinoFinnishFrenchFrench American IndianFrench CanadianGermanGerman RussianGhanaianGreekGuamanian/ChamorroGuatemalanGuyaneseHaitianHmongHonduranHopiHoumaHungarianIcelanderIndian (Asian)IndonesianInupiatIranianIraqiIrishIroquoisIsraeliItalianJamaicanJapaneseJordanianKenyanKiowaKoreanLaotianLatvianLebaneseLiberianLithuanianLumbeeLuxembourgerMacedonianMalaysianMalteseMarshalleseMenomineeMexicanMexican American IndianMongolianMoroccanNative HawaiianNavajoNepaleseNew ZealanderNicaraguanNigerianNorthern EuropeanNorwegianOkinawanOsageOttawaPaiutePakistaniPalestinianPanamanianParaguayanPennsylvania GermanPeruvianPimaPolishPortuguesePotawatomiPuebloPuerto RicanPuget Sound SalishRomanianRussianSalvadoranSamoanScandinavianScotch-IrishScottishSeminoleSenegaleseSerbianShoshoneSierra LeoneanSiouxSlavicSlovakSloveneSomaliSouth AfricanSouth AmericanSouth American IndianSoviet UnionSpaniardSpanishSpanish AmericanSpanish American IndianSri LankanSubsaharan AfricanSudaneseSwedishSwissSyrianTaiwaneseThaiTlingit-HaidaTohono O'OdhamTonganTrinidadian and TobagonianTsimshianTurkishU.S. Virgin IslanderUgandanUkrainianUruguayanUteVenezuelanVietnameseWelshWest IndianYakamaYaquiYugoslavianYumanYup'ikZimbabwean
Immigration
NonimmigrantsImmigrantsAfghanistanAfricaAlbaniaArgentinaArmeniaAsiaAustraliaAustriaBahamasBangladeshBarbadosBelarusBelgiumBelizeBoliviaBosnia and HerzegovinaBrazilBulgariaBurma/MyanmarCabo VerdeCambodiaCameroonCanadaCaribbeanCentral AmericaChileColombiaCongoCosta RicaCroatiaCubaCzechoslovakiaDenmarkDominicaDominican RepublicEastern AfricaEastern AsiaEastern EuropeEcuadorEgyptEl SalvadorEnglandEritreaEthiopiaEuropeFijiFranceGermanyGhanaGreeceGrenadaGuatemalaGuyanaHaitiHondurasHong KongHungaryIndiaIndonesiaIranIraqIrelandIsraelItalyJamaicaJapanJordanKazakhstanKenyaKoreaKuwaitLaosLatin AmericaLatviaLebanonLiberiaLithuaniaMalaysiaMexicoMicronesiaMiddle AfricaMoldovaMoroccoNepalNetherlandsNicaraguaNigeriaNorth AmericaNorth MacedoniaNorthern AfricaNorthern EuropeNorwayOceaniaPakistanPanamaPeruPhilippinesPolandPortugalRomaniaRussiaSaudi ArabiaScotlandSenegalSerbiaSierra LeoneSingaporeSomaliaSouth AfricaSouth AmericaSouth Central AsiaSouth Eastern AsiaSouthern EuropeSpainSri LankaSt. Vincent and the GrenadinesSudanSwedenSwitzerlandSyriaTaiwanThailandTrinidad and TobagoTurkeyUgandaUkraineUruguayUzbekistanVenezuelaVietnamWest IndiesWestern AfricaWestern AsiaWestern EuropeYemenZaireZimbabweAzores
Immigrants from China
Race
Ancestry
AfghanAfricanAlaska NativeAlaskan AthabascanAlbanianAleutAlsatianAmericanApacheArabArapahoArgentineanArmenianAssyrian/Chaldean/SyriacAustralianAustrianBahamianBangladeshiBarbadianBasqueBelgianBelizeanBermudanBhutaneseBlackfeetBolivianBrazilianBritishBritish West IndianBulgarianBurmeseCajunCambodianCanadianCape VerdeanCarpatho RusynCelticCentral AmericanCentral American IndianCherokeeCheyenneChickasawChileanChineseChippewaChoctawColombianColvilleComancheCosta RicanCreeCreekCroatianCrowCubanCypriotCzechCzechoslovakianDanishDelawareDominicanDutchDutch West IndianEastern EuropeanEcuadorianEgyptianEnglishEstonianEthiopianEuropeanFijianFilipinoFinnishFrenchFrench American IndianFrench CanadianGermanGerman RussianGhanaianGreekGuamanian/ChamorroGuatemalanGuyaneseHaitianHmongHonduranHopiHoumaHungarianIcelanderIndian (Asian)IndonesianInupiatIranianIraqiIrishIroquoisIsraeliItalianJamaicanJapaneseJordanianKenyanKiowaKoreanLaotianLatvianLebaneseLiberianLithuanianLumbeeLuxembourgerMacedonianMalaysianMalteseMarshalleseMenomineeMexicanMexican American IndianMongolianMoroccanNative HawaiianNavajoNepaleseNew ZealanderNicaraguanNigerianNorthern EuropeanNorwegianOkinawanOsageOttawaPaiutePakistaniPalestinianPanamanianParaguayanPennsylvania GermanPeruvianPimaPolishPortuguesePotawatomiPuebloPuerto RicanPuget Sound SalishRomanianRussianSalvadoranSamoanScandinavianScotch-IrishScottishSeminoleSenegaleseSerbianShoshoneSierra LeoneanSiouxSlavicSlovakSloveneSomaliSouth AfricanSouth AmericanSouth American IndianSoviet UnionSpaniardSpanishSpanish AmericanSpanish American IndianSri LankanSubsaharan AfricanSudaneseSwedishSwissSyrianTaiwaneseThaiTlingit-HaidaTohono O'OdhamTonganTrinidadian and TobagonianTsimshianTurkishU.S. Virgin IslanderUgandanUkrainianUruguayanUteVenezuelanVietnameseWelshWest IndianYakamaYaquiYugoslavianYumanYup'ikZimbabwean
Immigration
NonimmigrantsImmigrantsAfghanistanAfricaAlbaniaArgentinaArmeniaAsiaAustraliaAustriaBahamasBangladeshBarbadosBelarusBelgiumBelizeBoliviaBosnia and HerzegovinaBrazilBulgariaBurma/MyanmarCabo VerdeCameroonCanadaCaribbeanCentral AmericaChileChinaColombiaCongoCosta RicaCroatiaCubaCzechoslovakiaDenmarkDominicaDominican RepublicEastern AfricaEastern AsiaEastern EuropeEcuadorEgyptEl SalvadorEnglandEritreaEthiopiaEuropeFijiFranceGermanyGhanaGreeceGrenadaGuatemalaGuyanaHaitiHondurasHong KongHungaryIndiaIndonesiaIranIraqIrelandIsraelItalyJamaicaJapanJordanKazakhstanKenyaKoreaKuwaitLaosLatin AmericaLatviaLebanonLiberiaLithuaniaMalaysiaMexicoMicronesiaMiddle AfricaMoldovaMoroccoNepalNetherlandsNicaraguaNigeriaNorth AmericaNorth MacedoniaNorthern AfricaNorthern EuropeNorwayOceaniaPakistanPanamaPeruPhilippinesPolandPortugalRomaniaRussiaSaudi ArabiaScotlandSenegalSerbiaSierra LeoneSingaporeSomaliaSouth AfricaSouth AmericaSouth Central AsiaSouth Eastern AsiaSouthern EuropeSpainSri LankaSt. Vincent and the GrenadinesSudanSwedenSwitzerlandSyriaTaiwanThailandTrinidad and TobagoTurkeyUgandaUkraineUruguayUzbekistanVenezuelaVietnamWest IndiesWestern AfricaWestern AsiaWestern EuropeYemenZaireZimbabweAzores
3rd Grade
Income
Poverty
Unemployment
Labor Participation
Family Structure
Vehicle Availability
Education Level
Disability

3rd Grade Comparison

Immigrants from Cambodia

Immigrants from China

Tragic
Tragic
96.2%
3RD GRADE
0.0/ 100
METRIC RATING
334th/ 347
METRIC RANK
97.2%
3RD GRADE
0.2/ 100
METRIC RATING
270th/ 347
METRIC RANK

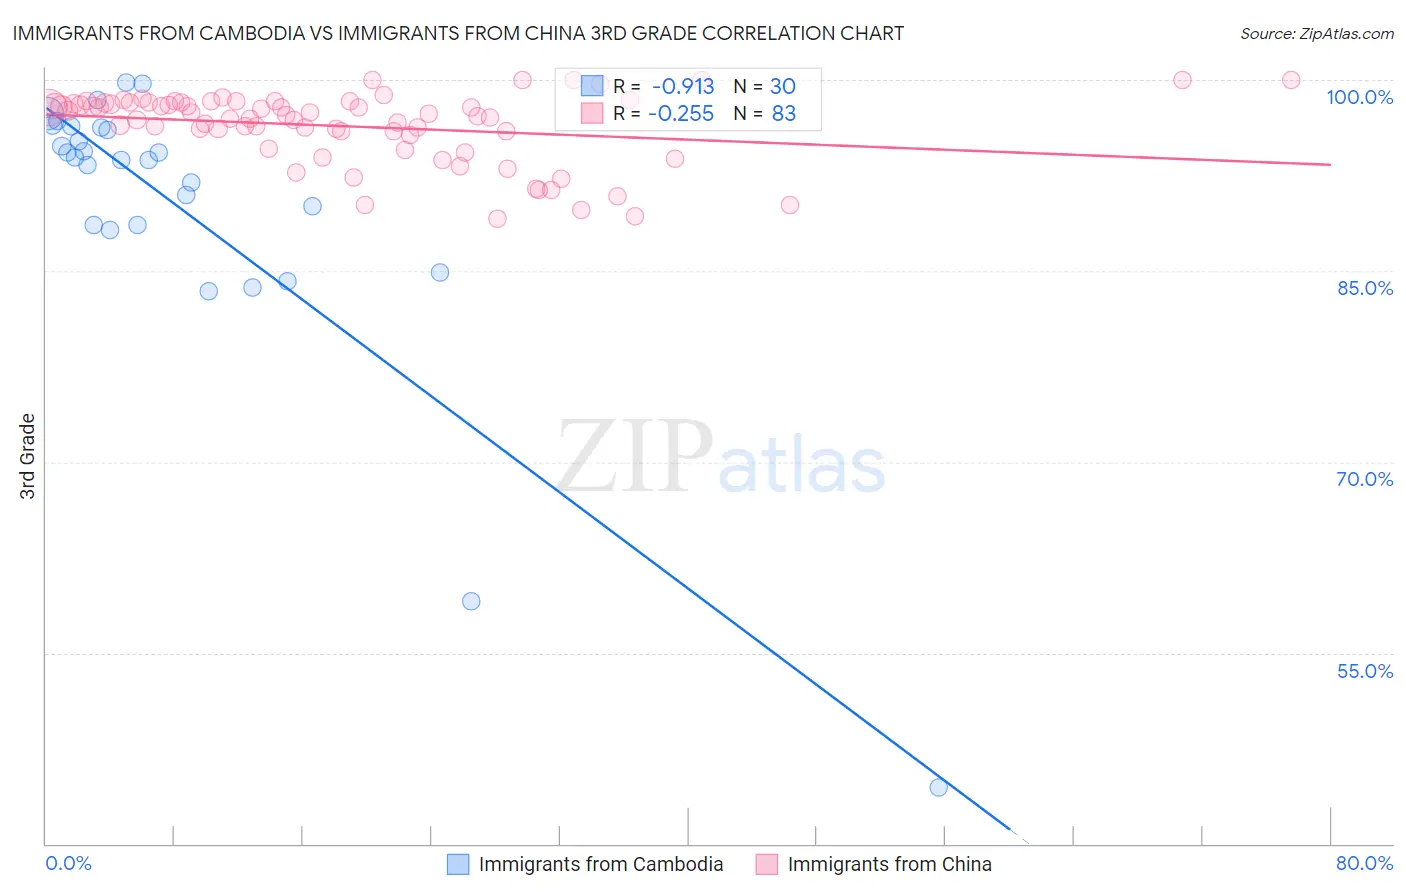
Immigrants from Cambodia vs Immigrants from China 3rd Grade Correlation Chart

The statistical analysis conducted on geographies consisting of 205,153,442 people shows a near-perfect negative correlation between the proportion of Immigrants from Cambodia and percentage of population with at least 3rd grade education in the United States with a correlation coefficient (R) of -0.913 and weighted average of 96.2%. Similarly, the statistical analysis conducted on geographies consisting of 457,082,957 people shows a weak negative correlation between the proportion of Immigrants from China and percentage of population with at least 3rd grade education in the United States with a correlation coefficient (R) of -0.255 and weighted average of 97.2%, a difference of 1.1%.
Immigrants from Cambodia vs Immigrants from China 3rd Grade

3rd Grade Correlation Summary

MeasurementImmigrants from CambodiaImmigrants from China
Minimum44.4%89.1%
Maximum99.8%100.0%
Range55.4%10.9%
Mean90.1%96.4%
Median93.8%97.2%
Interquartile 25% (IQ1)88.6%95.7%
Interquartile 75% (IQ3)96.2%98.2%
Interquartile Range (IQR)7.6%2.5%
Standard Deviation (Sample)11.6%2.8%
Standard Deviation (Population)11.4%2.7%

Similar Demographics by 3rd Grade

Demographics Similar to Immigrants from Cambodia by 3rd Grade

In terms of 3rd grade, the demographic groups most similar to Immigrants from Cambodia are Immigrants from Dominican Republic (96.2%, a difference of 0.0%), Immigrants from Fiji (96.2%, a difference of 0.020%), Immigrants from Cabo Verde (96.2%, a difference of 0.020%), Mexican (96.2%, a difference of 0.050%), and Immigrants from Latin America (96.2%, a difference of 0.060%).
DemographicsRating | Rank3rd Grade
Japanese
0.0
/100
|
#327
Tragic
96.4%
Bangladeshis
0.0
/100
|
#328
Tragic
96.3%
Immigrants | Honduras
0.0
/100
|
#329
Tragic
96.3%
Immigrants | Armenia
0.0
/100
|
#330
Tragic
96.3%
Immigrants | Latin America
0.0
/100
|
#331
Tragic
96.2%
Mexicans
0.0
/100
|
#332
Tragic
96.2%
Immigrants | Fiji
0.0
/100
|
#333
Tragic
96.2%
Immigrants | Cambodia
0.0
/100
|
#334
Tragic
96.2%
Immigrants | Dominican Republic
0.0
/100
|
#335
Tragic
96.2%
Immigrants | Cabo Verde
0.0
/100
|
#336
Tragic
96.2%
Central Americans
0.0
/100
|
#337
Tragic
96.1%
Guatemalans
0.0
/100
|
#338
Tragic
96.0%
Yakama
0.0
/100
|
#339
Tragic
95.9%
Nepalese
0.0
/100
|
#340
Tragic
95.9%
Immigrants | Central America
0.0
/100
|
#341
Tragic
95.8%

Demographics Similar to Immigrants from China by 3rd Grade

In terms of 3rd grade, the demographic groups most similar to Immigrants from China are Puerto Rican (97.2%, a difference of 0.010%), Ghanaian (97.2%, a difference of 0.010%), Immigrants from Peru (97.2%, a difference of 0.010%), Immigrants from Cameroon (97.2%, a difference of 0.010%), and Cuban (97.3%, a difference of 0.030%).
DemographicsRating | Rank3rd Grade
Taiwanese
0.3
/100
|
#263
Tragic
97.3%
West Indians
0.3
/100
|
#264
Tragic
97.3%
Immigrants | Jamaica
0.3
/100
|
#265
Tragic
97.3%
Yaqui
0.3
/100
|
#266
Tragic
97.3%
Immigrants | Nigeria
0.3
/100
|
#267
Tragic
97.3%
Cubans
0.2
/100
|
#268
Tragic
97.3%
Fijians
0.2
/100
|
#269
Tragic
97.3%
Immigrants | China
0.2
/100
|
#270
Tragic
97.2%
Puerto Ricans
0.2
/100
|
#271
Tragic
97.2%
Ghanaians
0.1
/100
|
#272
Tragic
97.2%
Immigrants | Peru
0.1
/100
|
#273
Tragic
97.2%
Immigrants | Cameroon
0.1
/100
|
#274
Tragic
97.2%
Immigrants | Uzbekistan
0.1
/100
|
#275
Tragic
97.2%
Immigrants | Bolivia
0.1
/100
|
#276
Tragic
97.2%
Trinidadians and Tobagonians
0.1
/100
|
#277
Tragic
97.2%