Immigrants from Bangladesh vs Lumbee 2nd Grade

COMPARE

Immigrants from Bangladesh
Race
Ancestry
AfghanAfricanAlaska NativeAlaskan AthabascanAlbanianAleutAlsatianAmericanApacheArabArapahoArgentineanArmenianAssyrian/Chaldean/SyriacAustralianAustrianBahamianBangladeshiBarbadianBasqueBelgianBelizeanBermudanBhutaneseBlackfeetBolivianBrazilianBritishBritish West IndianBulgarianBurmeseCajunCambodianCanadianCape VerdeanCarpatho RusynCelticCentral AmericanCentral American IndianCherokeeCheyenneChickasawChileanChineseChippewaChoctawColombianColvilleComancheCosta RicanCreeCreekCroatianCrowCubanCypriotCzechCzechoslovakianDanishDelawareDominicanDutchDutch West IndianEastern EuropeanEcuadorianEgyptianEnglishEstonianEthiopianEuropeanFijianFilipinoFinnishFrenchFrench American IndianFrench CanadianGermanGerman RussianGhanaianGreekGuamanian/ChamorroGuatemalanGuyaneseHaitianHmongHonduranHopiHoumaHungarianIcelanderIndian (Asian)IndonesianInupiatIranianIraqiIrishIroquoisIsraeliItalianJamaicanJapaneseJordanianKenyanKiowaKoreanLaotianLatvianLebaneseLiberianLithuanianLuxembourgerMacedonianMalaysianMalteseMarshalleseMenomineeMexicanMexican American IndianMongolianMoroccanNative HawaiianNavajoNepaleseNew ZealanderNicaraguanNigerianNorthern EuropeanNorwegianOkinawanOsageOttawaPaiutePakistaniPalestinianPanamanianParaguayanPennsylvania GermanPeruvianPimaPolishPortuguesePotawatomiPuebloPuerto RicanPuget Sound SalishRomanianRussianSalvadoranSamoanScandinavianScotch-IrishScottishSeminoleSenegaleseSerbianShoshoneSierra LeoneanSiouxSlavicSlovakSloveneSomaliSouth AfricanSouth AmericanSouth American IndianSoviet UnionSpaniardSpanishSpanish AmericanSpanish American IndianSri LankanSubsaharan AfricanSudaneseSwedishSwissSyrianTaiwaneseThaiTlingit-HaidaTohono O'OdhamTonganTrinidadian and TobagonianTsimshianTurkishU.S. Virgin IslanderUgandanUkrainianUruguayanUteVenezuelanVietnameseWelshWest IndianYakamaYaquiYugoslavianYumanYup'ikZimbabwean
Immigration
NonimmigrantsImmigrantsAfghanistanAfricaAlbaniaArgentinaArmeniaAsiaAustraliaAustriaBahamasBangladeshBarbadosBelarusBelgiumBelizeBoliviaBosnia and HerzegovinaBrazilBulgariaBurma/MyanmarCabo VerdeCambodiaCameroonCanadaCaribbeanCentral AmericaChileChinaColombiaCongoCosta RicaCroatiaCubaCzechoslovakiaDenmarkDominicaDominican RepublicEastern AfricaEastern AsiaEastern EuropeEcuadorEgyptEl SalvadorEnglandEritreaEthiopiaEuropeFijiFranceGermanyGhanaGreeceGrenadaGuatemalaGuyanaHaitiHondurasHong KongHungaryIndiaIndonesiaIranIraqIrelandIsraelItalyJamaicaJapanJordanKazakhstanKenyaKoreaKuwaitLaosLatin AmericaLatviaLebanonLiberiaLithuaniaMalaysiaMexicoMicronesiaMiddle AfricaMoldovaMoroccoNepalNetherlandsNicaraguaNigeriaNorth AmericaNorth MacedoniaNorthern AfricaNorthern EuropeNorwayOceaniaPakistanPanamaPeruPhilippinesPolandPortugalRomaniaRussiaSaudi ArabiaScotlandSenegalSerbiaSierra LeoneSingaporeSomaliaSouth AfricaSouth AmericaSouth Central AsiaSouth Eastern AsiaSouthern EuropeSpainSri LankaSt. Vincent and the GrenadinesSudanSwedenSwitzerlandSyriaTaiwanThailandTrinidad and TobagoTurkeyUgandaUkraineUruguayUzbekistanVenezuelaVietnamWest IndiesWestern AfricaWestern AsiaWestern EuropeYemenZaireZimbabweAzores
Lumbee
Race
Ancestry
AfghanAfricanAlaska NativeAlaskan AthabascanAlbanianAleutAlsatianAmericanApacheArabArapahoArgentineanArmenianAssyrian/Chaldean/SyriacAustralianAustrianBahamianBangladeshiBarbadianBasqueBelgianBelizeanBermudanBhutaneseBlackfeetBolivianBrazilianBritishBritish West IndianBulgarianBurmeseCajunCambodianCanadianCape VerdeanCarpatho RusynCelticCentral AmericanCentral American IndianCherokeeCheyenneChickasawChileanChineseChippewaChoctawColombianColvilleComancheCosta RicanCreeCreekCroatianCrowCubanCypriotCzechCzechoslovakianDanishDelawareDominicanDutchDutch West IndianEastern EuropeanEcuadorianEgyptianEnglishEstonianEthiopianEuropeanFijianFilipinoFinnishFrenchFrench American IndianFrench CanadianGermanGerman RussianGhanaianGreekGuamanian/ChamorroGuatemalanGuyaneseHaitianHmongHonduranHopiHoumaHungarianIcelanderIndian (Asian)IndonesianInupiatIranianIraqiIrishIroquoisIsraeliItalianJamaicanJapaneseJordanianKenyanKiowaKoreanLaotianLatvianLebaneseLiberianLithuanianLumbeeLuxembourgerMacedonianMalaysianMalteseMarshalleseMenomineeMexicanMexican American IndianMongolianMoroccanNative HawaiianNavajoNepaleseNew ZealanderNicaraguanNigerianNorthern EuropeanNorwegianOkinawanOsageOttawaPaiutePakistaniPalestinianPanamanianParaguayanPennsylvania GermanPeruvianPimaPolishPortuguesePotawatomiPuebloPuerto RicanPuget Sound SalishRomanianRussianSalvadoranSamoanScandinavianScotch-IrishScottishSeminoleSenegaleseSerbianShoshoneSierra LeoneanSiouxSlavicSlovakSloveneSomaliSouth AfricanSouth AmericanSouth American IndianSoviet UnionSpaniardSpanishSpanish AmericanSpanish American IndianSri LankanSubsaharan AfricanSudaneseSwedishSwissSyrianTaiwaneseThaiTlingit-HaidaTohono O'OdhamTonganTrinidadian and TobagonianTsimshianTurkishU.S. Virgin IslanderUgandanUkrainianUruguayanUteVenezuelanVietnameseWelshWest IndianYakamaYaquiYugoslavianYumanYup'ikZimbabwean
Immigration
NonimmigrantsImmigrantsAfghanistanAfricaAlbaniaArgentinaArmeniaAsiaAustraliaAustriaBahamasBarbadosBelarusBelgiumBelizeBoliviaBosnia and HerzegovinaBrazilBulgariaBurma/MyanmarCabo VerdeCambodiaCameroonCanadaCaribbeanCentral AmericaChileChinaColombiaCongoCosta RicaCroatiaCubaCzechoslovakiaDenmarkDominicaDominican RepublicEastern AfricaEastern AsiaEastern EuropeEcuadorEgyptEl SalvadorEnglandEritreaEthiopiaEuropeFijiFranceGermanyGhanaGreeceGrenadaGuatemalaGuyanaHaitiHondurasHong KongHungaryIndiaIndonesiaIranIraqIrelandIsraelItalyJamaicaJapanJordanKazakhstanKenyaKoreaKuwaitLaosLatin AmericaLatviaLebanonLiberiaLithuaniaMalaysiaMexicoMicronesiaMiddle AfricaMoldovaMoroccoNepalNetherlandsNicaraguaNigeriaNorth AmericaNorth MacedoniaNorthern AfricaNorthern EuropeNorwayOceaniaPakistanPanamaPeruPhilippinesPolandPortugalRomaniaRussiaSaudi ArabiaScotlandSenegalSerbiaSierra LeoneSingaporeSomaliaSouth AfricaSouth AmericaSouth Central AsiaSouth Eastern AsiaSouthern EuropeSpainSri LankaSt. Vincent and the GrenadinesSudanSwedenSwitzerlandSyriaTaiwanThailandTrinidad and TobagoTurkeyUgandaUkraineUruguayUzbekistanVenezuelaVietnamWest IndiesWestern AfricaWestern AsiaWestern EuropeYemenZaireZimbabweAzores
2nd Grade
Income
Poverty
Unemployment
Labor Participation
Family Structure
Vehicle Availability
Education Level
Disability

2nd Grade Comparison

Immigrants from Bangladesh

Lumbee

Tragic
Exceptional
96.7%
2ND GRADE
0.0/ 100
METRIC RATING
322nd/ 347
METRIC RANK
98.4%
2ND GRADE
99.9/ 100
METRIC RATING
46th/ 347
METRIC RANK

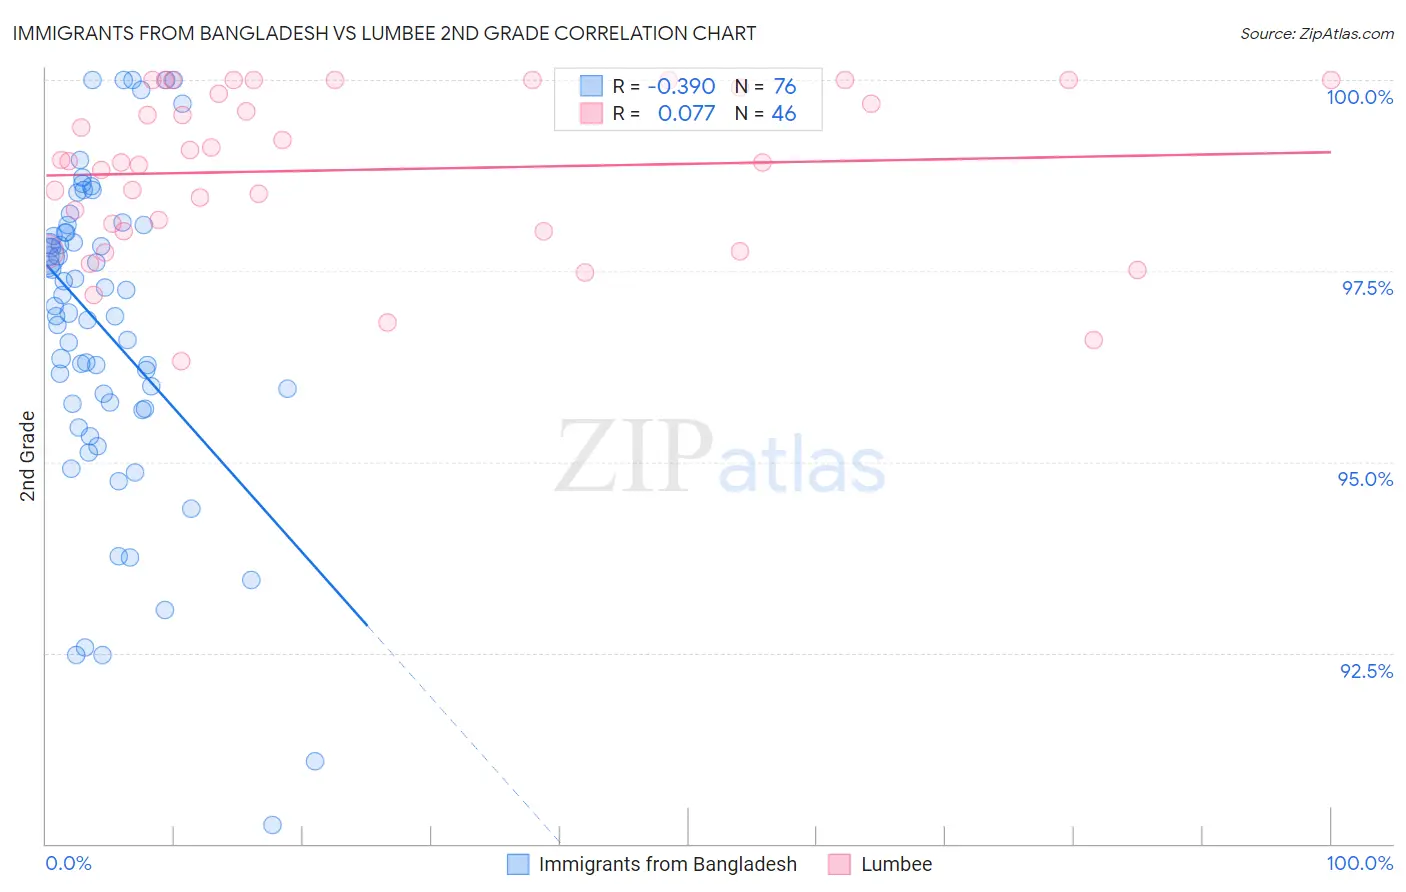
Immigrants from Bangladesh vs Lumbee 2nd Grade Correlation Chart

The statistical analysis conducted on geographies consisting of 203,681,254 people shows a mild negative correlation between the proportion of Immigrants from Bangladesh and percentage of population with at least 2nd grade education in the United States with a correlation coefficient (R) of -0.390 and weighted average of 96.7%. Similarly, the statistical analysis conducted on geographies consisting of 92,298,794 people shows a slight positive correlation between the proportion of Lumbee and percentage of population with at least 2nd grade education in the United States with a correlation coefficient (R) of 0.077 and weighted average of 98.4%, a difference of 1.7%.
Immigrants from Bangladesh vs Lumbee 2nd Grade

2nd Grade Correlation Summary

MeasurementImmigrants from BangladeshLumbee
Minimum90.2%96.3%
Maximum100.0%100.0%
Range9.8%3.7%
Mean96.7%98.8%
Median97.0%98.9%
Interquartile 25% (IQ1)95.7%98.0%
Interquartile 75% (IQ3)98.0%99.9%
Interquartile Range (IQR)2.3%1.9%
Standard Deviation (Sample)2.1%1.1%
Standard Deviation (Population)2.1%1.0%

Similar Demographics by 2nd Grade

Demographics Similar to Immigrants from Bangladesh by 2nd Grade

In terms of 2nd grade, the demographic groups most similar to Immigrants from Bangladesh are Immigrants from Guyana (96.7%, a difference of 0.030%), Immigrants from Burma/Myanmar (96.7%, a difference of 0.030%), Vietnamese (96.7%, a difference of 0.030%), Honduran (96.7%, a difference of 0.040%), and Immigrants from Laos (96.7%, a difference of 0.040%).
DemographicsRating | Rank2nd Grade
Immigrants | Belize
0.0
/100
|
#315
Tragic
96.8%
Hondurans
0.0
/100
|
#316
Tragic
96.7%
Immigrants | Laos
0.0
/100
|
#317
Tragic
96.7%
Indonesians
0.0
/100
|
#318
Tragic
96.7%
Immigrants | Nicaragua
0.0
/100
|
#319
Tragic
96.7%
Immigrants | Guyana
0.0
/100
|
#320
Tragic
96.7%
Immigrants | Burma/Myanmar
0.0
/100
|
#321
Tragic
96.7%
Immigrants | Bangladesh
0.0
/100
|
#322
Tragic
96.7%
Vietnamese
0.0
/100
|
#323
Tragic
96.7%
Mexican American Indians
0.0
/100
|
#324
Tragic
96.7%
Dominicans
0.0
/100
|
#325
Tragic
96.6%
Immigrants | Honduras
0.0
/100
|
#326
Tragic
96.6%
Immigrants | Vietnam
0.0
/100
|
#327
Tragic
96.5%
Mexicans
0.0
/100
|
#328
Tragic
96.5%
Japanese
0.0
/100
|
#329
Tragic
96.5%

Demographics Similar to Lumbee by 2nd Grade

In terms of 2nd grade, the demographic groups most similar to Lumbee are Hungarian (98.4%, a difference of 0.010%), Ottawa (98.4%, a difference of 0.010%), Czechoslovakian (98.4%, a difference of 0.010%), Northern European (98.4%, a difference of 0.020%), and Native Hawaiian (98.4%, a difference of 0.030%).
DemographicsRating | Rank2nd Grade
Chippewa
99.9
/100
|
#39
Exceptional
98.4%
Luxembourgers
99.9
/100
|
#40
Exceptional
98.4%
Eastern Europeans
99.9
/100
|
#41
Exceptional
98.4%
Native Hawaiians
99.9
/100
|
#42
Exceptional
98.4%
Belgians
99.9
/100
|
#43
Exceptional
98.4%
Northern Europeans
99.9
/100
|
#44
Exceptional
98.4%
Hungarians
99.9
/100
|
#45
Exceptional
98.4%
Lumbee
99.9
/100
|
#46
Exceptional
98.4%
Ottawa
99.9
/100
|
#47
Exceptional
98.4%
Czechoslovakians
99.9
/100
|
#48
Exceptional
98.4%
Celtics
99.8
/100
|
#49
Exceptional
98.4%
Whites/Caucasians
99.8
/100
|
#50
Exceptional
98.4%
Estonians
99.8
/100
|
#51
Exceptional
98.4%
Australians
99.8
/100
|
#52
Exceptional
98.4%
Pueblo
99.8
/100
|
#53
Exceptional
98.3%