Immigrants from Bangladesh vs Immigrants from Japan 2nd Grade

COMPARE

Immigrants from Bangladesh
Race
Ancestry
AfghanAfricanAlaska NativeAlaskan AthabascanAlbanianAleutAlsatianAmericanApacheArabArapahoArgentineanArmenianAssyrian/Chaldean/SyriacAustralianAustrianBahamianBangladeshiBarbadianBasqueBelgianBelizeanBermudanBhutaneseBlackfeetBolivianBrazilianBritishBritish West IndianBulgarianBurmeseCajunCambodianCanadianCape VerdeanCarpatho RusynCelticCentral AmericanCentral American IndianCherokeeCheyenneChickasawChileanChineseChippewaChoctawColombianColvilleComancheCosta RicanCreeCreekCroatianCrowCubanCypriotCzechCzechoslovakianDanishDelawareDominicanDutchDutch West IndianEastern EuropeanEcuadorianEgyptianEnglishEstonianEthiopianEuropeanFijianFilipinoFinnishFrenchFrench American IndianFrench CanadianGermanGerman RussianGhanaianGreekGuamanian/ChamorroGuatemalanGuyaneseHaitianHmongHonduranHopiHoumaHungarianIcelanderIndian (Asian)IndonesianInupiatIranianIraqiIrishIroquoisIsraeliItalianJamaicanJapaneseJordanianKenyanKiowaKoreanLaotianLatvianLebaneseLiberianLithuanianLumbeeLuxembourgerMacedonianMalaysianMalteseMarshalleseMenomineeMexicanMexican American IndianMongolianMoroccanNative HawaiianNavajoNepaleseNew ZealanderNicaraguanNigerianNorthern EuropeanNorwegianOkinawanOsageOttawaPaiutePakistaniPalestinianPanamanianParaguayanPennsylvania GermanPeruvianPimaPolishPortuguesePotawatomiPuebloPuerto RicanPuget Sound SalishRomanianRussianSalvadoranSamoanScandinavianScotch-IrishScottishSeminoleSenegaleseSerbianShoshoneSierra LeoneanSiouxSlavicSlovakSloveneSomaliSouth AfricanSouth AmericanSouth American IndianSoviet UnionSpaniardSpanishSpanish AmericanSpanish American IndianSri LankanSubsaharan AfricanSudaneseSwedishSwissSyrianTaiwaneseThaiTlingit-HaidaTohono O'OdhamTonganTrinidadian and TobagonianTsimshianTurkishU.S. Virgin IslanderUgandanUkrainianUruguayanUteVenezuelanVietnameseWelshWest IndianYakamaYaquiYugoslavianYumanYup'ikZimbabwean
Immigration
NonimmigrantsImmigrantsAfghanistanAfricaAlbaniaArgentinaArmeniaAsiaAustraliaAustriaBahamasBangladeshBarbadosBelarusBelgiumBelizeBoliviaBosnia and HerzegovinaBrazilBulgariaBurma/MyanmarCabo VerdeCambodiaCameroonCanadaCaribbeanCentral AmericaChileChinaColombiaCongoCosta RicaCroatiaCubaCzechoslovakiaDenmarkDominicaDominican RepublicEastern AfricaEastern AsiaEastern EuropeEcuadorEgyptEl SalvadorEnglandEritreaEthiopiaEuropeFijiFranceGermanyGhanaGreeceGrenadaGuatemalaGuyanaHaitiHondurasHong KongHungaryIndiaIndonesiaIranIraqIrelandIsraelItalyJamaicaJordanKazakhstanKenyaKoreaKuwaitLaosLatin AmericaLatviaLebanonLiberiaLithuaniaMalaysiaMexicoMicronesiaMiddle AfricaMoldovaMoroccoNepalNetherlandsNicaraguaNigeriaNorth AmericaNorth MacedoniaNorthern AfricaNorthern EuropeNorwayOceaniaPakistanPanamaPeruPhilippinesPolandPortugalRomaniaRussiaSaudi ArabiaScotlandSenegalSerbiaSierra LeoneSingaporeSomaliaSouth AfricaSouth AmericaSouth Central AsiaSouth Eastern AsiaSouthern EuropeSpainSri LankaSt. Vincent and the GrenadinesSudanSwedenSwitzerlandSyriaTaiwanThailandTrinidad and TobagoTurkeyUgandaUkraineUruguayUzbekistanVenezuelaVietnamWest IndiesWestern AfricaWestern AsiaWestern EuropeYemenZaireZimbabweAzores
Immigrants from Japan
Race
Ancestry
AfghanAfricanAlaska NativeAlaskan AthabascanAlbanianAleutAlsatianAmericanApacheArabArapahoArgentineanArmenianAssyrian/Chaldean/SyriacAustralianAustrianBahamianBangladeshiBarbadianBasqueBelgianBelizeanBermudanBhutaneseBlackfeetBolivianBrazilianBritishBritish West IndianBulgarianBurmeseCajunCambodianCanadianCape VerdeanCarpatho RusynCelticCentral AmericanCentral American IndianCherokeeCheyenneChickasawChileanChineseChippewaChoctawColombianColvilleComancheCosta RicanCreeCreekCroatianCrowCubanCypriotCzechCzechoslovakianDanishDelawareDominicanDutchDutch West IndianEastern EuropeanEcuadorianEgyptianEnglishEstonianEthiopianEuropeanFijianFilipinoFinnishFrenchFrench American IndianFrench CanadianGermanGerman RussianGhanaianGreekGuamanian/ChamorroGuatemalanGuyaneseHaitianHmongHonduranHopiHoumaHungarianIcelanderIndian (Asian)IndonesianInupiatIranianIraqiIrishIroquoisIsraeliItalianJamaicanJapaneseJordanianKenyanKiowaKoreanLaotianLatvianLebaneseLiberianLithuanianLumbeeLuxembourgerMacedonianMalaysianMalteseMarshalleseMenomineeMexicanMexican American IndianMongolianMoroccanNative HawaiianNavajoNepaleseNew ZealanderNicaraguanNigerianNorthern EuropeanNorwegianOkinawanOsageOttawaPaiutePakistaniPalestinianPanamanianParaguayanPennsylvania GermanPeruvianPimaPolishPortuguesePotawatomiPuebloPuerto RicanPuget Sound SalishRomanianRussianSalvadoranSamoanScandinavianScotch-IrishScottishSeminoleSenegaleseSerbianShoshoneSierra LeoneanSiouxSlavicSlovakSloveneSomaliSouth AfricanSouth AmericanSouth American IndianSoviet UnionSpaniardSpanishSpanish AmericanSpanish American IndianSri LankanSubsaharan AfricanSudaneseSwedishSwissSyrianTaiwaneseThaiTlingit-HaidaTohono O'OdhamTonganTrinidadian and TobagonianTsimshianTurkishU.S. Virgin IslanderUgandanUkrainianUruguayanUteVenezuelanVietnameseWelshWest IndianYakamaYaquiYugoslavianYumanYup'ikZimbabwean
Immigration
NonimmigrantsImmigrantsAfghanistanAfricaAlbaniaArgentinaArmeniaAsiaAustraliaAustriaBahamasBarbadosBelarusBelgiumBelizeBoliviaBosnia and HerzegovinaBrazilBulgariaBurma/MyanmarCabo VerdeCambodiaCameroonCanadaCaribbeanCentral AmericaChileChinaColombiaCongoCosta RicaCroatiaCubaCzechoslovakiaDenmarkDominicaDominican RepublicEastern AfricaEastern AsiaEastern EuropeEcuadorEgyptEl SalvadorEnglandEritreaEthiopiaEuropeFijiFranceGermanyGhanaGreeceGrenadaGuatemalaGuyanaHaitiHondurasHong KongHungaryIndiaIndonesiaIranIraqIrelandIsraelItalyJamaicaJapanJordanKazakhstanKenyaKoreaKuwaitLaosLatin AmericaLatviaLebanonLiberiaLithuaniaMalaysiaMexicoMicronesiaMiddle AfricaMoldovaMoroccoNepalNetherlandsNicaraguaNigeriaNorth AmericaNorth MacedoniaNorthern AfricaNorthern EuropeNorwayOceaniaPakistanPanamaPeruPhilippinesPolandPortugalRomaniaRussiaSaudi ArabiaScotlandSenegalSerbiaSierra LeoneSingaporeSomaliaSouth AfricaSouth AmericaSouth Central AsiaSouth Eastern AsiaSouthern EuropeSpainSri LankaSt. Vincent and the GrenadinesSudanSwedenSwitzerlandSyriaTaiwanThailandTrinidad and TobagoTurkeyUgandaUkraineUruguayUzbekistanVenezuelaVietnamWest IndiesWestern AfricaWestern AsiaWestern EuropeYemenZaireZimbabweAzores
2nd Grade
Income
Poverty
Unemployment
Labor Participation
Family Structure
Vehicle Availability
Education Level
Disability

2nd Grade Comparison

Immigrants from Bangladesh

Immigrants from Japan

Tragic
Exceptional
96.7%
2ND GRADE
0.0/ 100
METRIC RATING
322nd/ 347
METRIC RANK
98.1%
2ND GRADE
94.1/ 100
METRIC RATING
123rd/ 347
METRIC RANK

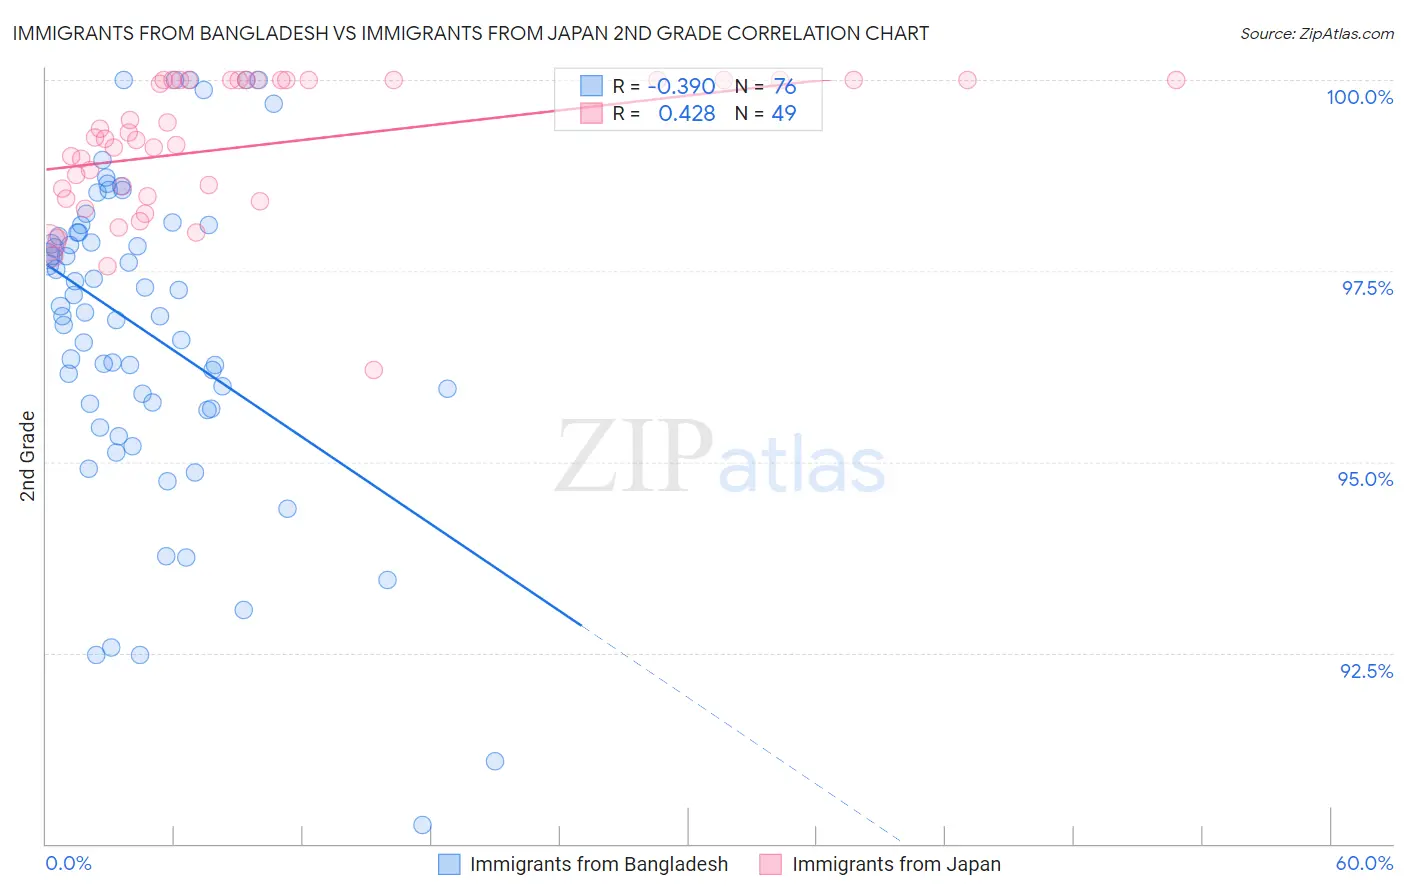
Immigrants from Bangladesh vs Immigrants from Japan 2nd Grade Correlation Chart

The statistical analysis conducted on geographies consisting of 203,681,254 people shows a mild negative correlation between the proportion of Immigrants from Bangladesh and percentage of population with at least 2nd grade education in the United States with a correlation coefficient (R) of -0.390 and weighted average of 96.7%. Similarly, the statistical analysis conducted on geographies consisting of 340,149,128 people shows a moderate positive correlation between the proportion of Immigrants from Japan and percentage of population with at least 2nd grade education in the United States with a correlation coefficient (R) of 0.428 and weighted average of 98.1%, a difference of 1.4%.
Immigrants from Bangladesh vs Immigrants from Japan 2nd Grade

2nd Grade Correlation Summary

MeasurementImmigrants from BangladeshImmigrants from Japan
Minimum90.2%96.2%
Maximum100.0%100.0%
Range9.8%3.8%
Mean96.7%99.1%
Median97.0%99.2%
Interquartile 25% (IQ1)95.7%98.5%
Interquartile 75% (IQ3)98.0%100.0%
Interquartile Range (IQR)2.3%1.5%
Standard Deviation (Sample)2.1%0.89%
Standard Deviation (Population)2.1%0.88%

Similar Demographics by 2nd Grade

Demographics Similar to Immigrants from Bangladesh by 2nd Grade

In terms of 2nd grade, the demographic groups most similar to Immigrants from Bangladesh are Immigrants from Guyana (96.7%, a difference of 0.030%), Immigrants from Burma/Myanmar (96.7%, a difference of 0.030%), Vietnamese (96.7%, a difference of 0.030%), Honduran (96.7%, a difference of 0.040%), and Immigrants from Laos (96.7%, a difference of 0.040%).
DemographicsRating | Rank2nd Grade
Immigrants | Belize
0.0
/100
|
#315
Tragic
96.8%
Hondurans
0.0
/100
|
#316
Tragic
96.7%
Immigrants | Laos
0.0
/100
|
#317
Tragic
96.7%
Indonesians
0.0
/100
|
#318
Tragic
96.7%
Immigrants | Nicaragua
0.0
/100
|
#319
Tragic
96.7%
Immigrants | Guyana
0.0
/100
|
#320
Tragic
96.7%
Immigrants | Burma/Myanmar
0.0
/100
|
#321
Tragic
96.7%
Immigrants | Bangladesh
0.0
/100
|
#322
Tragic
96.7%
Vietnamese
0.0
/100
|
#323
Tragic
96.7%
Mexican American Indians
0.0
/100
|
#324
Tragic
96.7%
Dominicans
0.0
/100
|
#325
Tragic
96.6%
Immigrants | Honduras
0.0
/100
|
#326
Tragic
96.6%
Immigrants | Vietnam
0.0
/100
|
#327
Tragic
96.5%
Mexicans
0.0
/100
|
#328
Tragic
96.5%
Japanese
0.0
/100
|
#329
Tragic
96.5%

Demographics Similar to Immigrants from Japan by 2nd Grade

In terms of 2nd grade, the demographic groups most similar to Immigrants from Japan are Immigrants from Zimbabwe (98.1%, a difference of 0.0%), Lebanese (98.1%, a difference of 0.0%), Menominee (98.1%, a difference of 0.0%), Iroquois (98.1%, a difference of 0.0%), and Syrian (98.1%, a difference of 0.0%).
DemographicsRating | Rank2nd Grade
Spanish
95.8
/100
|
#116
Exceptional
98.1%
Ute
95.7
/100
|
#117
Exceptional
98.1%
Immigrants | France
95.6
/100
|
#118
Exceptional
98.1%
Thais
95.3
/100
|
#119
Exceptional
98.1%
Okinawans
94.9
/100
|
#120
Exceptional
98.1%
Immigrants | Zimbabwe
94.4
/100
|
#121
Exceptional
98.1%
Lebanese
94.2
/100
|
#122
Exceptional
98.1%
Immigrants | Japan
94.1
/100
|
#123
Exceptional
98.1%
Menominee
94.1
/100
|
#124
Exceptional
98.1%
Iroquois
94.1
/100
|
#125
Exceptional
98.1%
Syrians
94.0
/100
|
#126
Exceptional
98.1%
Immigrants | Saudi Arabia
93.6
/100
|
#127
Exceptional
98.1%
Immigrants | Serbia
92.3
/100
|
#128
Exceptional
98.1%
Immigrants | Croatia
92.1
/100
|
#129
Exceptional
98.1%
Seminole
91.1
/100
|
#130
Exceptional
98.0%