Immigrants from Asia vs Russian 12th Grade, No Diploma

COMPARE

Immigrants from Asia
Race
Ancestry
AfghanAfricanAlaska NativeAlaskan AthabascanAlbanianAleutAlsatianAmericanApacheArabArapahoArgentineanArmenianAssyrian/Chaldean/SyriacAustralianAustrianBahamianBangladeshiBarbadianBasqueBelgianBelizeanBermudanBhutaneseBlackfeetBolivianBrazilianBritishBritish West IndianBulgarianBurmeseCajunCambodianCanadianCape VerdeanCarpatho RusynCelticCentral AmericanCentral American IndianCherokeeCheyenneChickasawChileanChineseChippewaChoctawColombianColvilleComancheCosta RicanCreeCreekCroatianCrowCubanCypriotCzechCzechoslovakianDanishDelawareDominicanDutchDutch West IndianEastern EuropeanEcuadorianEgyptianEnglishEstonianEthiopianEuropeanFijianFilipinoFinnishFrenchFrench American IndianFrench CanadianGermanGerman RussianGhanaianGreekGuamanian/ChamorroGuatemalanGuyaneseHaitianHmongHonduranHopiHoumaHungarianIcelanderIndian (Asian)IndonesianInupiatIranianIraqiIrishIroquoisIsraeliItalianJamaicanJapaneseJordanianKenyanKiowaKoreanLaotianLatvianLebaneseLiberianLithuanianLumbeeLuxembourgerMacedonianMalaysianMalteseMarshalleseMenomineeMexicanMexican American IndianMongolianMoroccanNative HawaiianNavajoNepaleseNew ZealanderNicaraguanNigerianNorthern EuropeanNorwegianOkinawanOsageOttawaPaiutePakistaniPalestinianPanamanianParaguayanPennsylvania GermanPeruvianPimaPolishPortuguesePotawatomiPuebloPuerto RicanPuget Sound SalishRomanianSalvadoranSamoanScandinavianScotch-IrishScottishSeminoleSenegaleseSerbianShoshoneSierra LeoneanSiouxSlavicSlovakSloveneSomaliSouth AfricanSouth AmericanSouth American IndianSoviet UnionSpaniardSpanishSpanish AmericanSpanish American IndianSri LankanSubsaharan AfricanSudaneseSwedishSwissSyrianTaiwaneseThaiTlingit-HaidaTohono O'OdhamTonganTrinidadian and TobagonianTsimshianTurkishU.S. Virgin IslanderUgandanUkrainianUruguayanUteVenezuelanVietnameseWelshWest IndianYakamaYaquiYugoslavianYumanYup'ikZimbabwean
Immigration
NonimmigrantsImmigrantsAfghanistanAfricaAlbaniaArgentinaArmeniaAsiaAustraliaAustriaBahamasBangladeshBarbadosBelarusBelgiumBelizeBoliviaBosnia and HerzegovinaBrazilBulgariaBurma/MyanmarCabo VerdeCambodiaCameroonCanadaCaribbeanCentral AmericaChileChinaColombiaCongoCosta RicaCroatiaCubaCzechoslovakiaDenmarkDominicaDominican RepublicEastern AfricaEastern AsiaEastern EuropeEcuadorEgyptEl SalvadorEnglandEritreaEthiopiaEuropeFijiFranceGermanyGhanaGreeceGrenadaGuatemalaGuyanaHaitiHondurasHong KongHungaryIndiaIndonesiaIranIraqIrelandIsraelItalyJamaicaJapanJordanKazakhstanKenyaKoreaKuwaitLaosLatin AmericaLatviaLebanonLiberiaLithuaniaMalaysiaMexicoMicronesiaMiddle AfricaMoldovaMoroccoNepalNetherlandsNicaraguaNigeriaNorth AmericaNorth MacedoniaNorthern AfricaNorthern EuropeNorwayOceaniaPakistanPanamaPeruPhilippinesPolandPortugalRomaniaRussiaSaudi ArabiaScotlandSenegalSerbiaSierra LeoneSingaporeSomaliaSouth AfricaSouth AmericaSouth Central AsiaSouth Eastern AsiaSouthern EuropeSpainSri LankaSt. Vincent and the GrenadinesSudanSwedenSwitzerlandSyriaTaiwanThailandTrinidad and TobagoTurkeyUgandaUkraineUruguayUzbekistanVenezuelaVietnamWest IndiesWestern AfricaWestern AsiaWestern EuropeYemenZaireZimbabweAzores
Russian
Race
Ancestry
AfghanAfricanAlaska NativeAlaskan AthabascanAlbanianAleutAlsatianAmericanApacheArabArapahoArgentineanArmenianAssyrian/Chaldean/SyriacAustralianAustrianBahamianBangladeshiBarbadianBasqueBelgianBelizeanBermudanBhutaneseBlackfeetBolivianBrazilianBritishBritish West IndianBulgarianBurmeseCajunCambodianCanadianCape VerdeanCarpatho RusynCelticCentral AmericanCentral American IndianCherokeeCheyenneChickasawChileanChineseChippewaChoctawColombianColvilleComancheCosta RicanCreeCreekCroatianCrowCubanCypriotCzechCzechoslovakianDanishDelawareDominicanDutchDutch West IndianEastern EuropeanEcuadorianEgyptianEnglishEstonianEthiopianEuropeanFijianFilipinoFinnishFrenchFrench American IndianFrench CanadianGermanGerman RussianGhanaianGreekGuamanian/ChamorroGuatemalanGuyaneseHaitianHmongHonduranHopiHoumaHungarianIcelanderIndian (Asian)IndonesianInupiatIranianIraqiIrishIroquoisIsraeliItalianJamaicanJapaneseJordanianKenyanKiowaKoreanLaotianLatvianLebaneseLiberianLithuanianLumbeeLuxembourgerMacedonianMalaysianMalteseMarshalleseMenomineeMexicanMexican American IndianMongolianMoroccanNative HawaiianNavajoNepaleseNew ZealanderNicaraguanNigerianNorthern EuropeanNorwegianOkinawanOsageOttawaPaiutePakistaniPalestinianPanamanianParaguayanPennsylvania GermanPeruvianPimaPolishPortuguesePotawatomiPuebloPuerto RicanPuget Sound SalishRomanianRussianSalvadoranSamoanScandinavianScotch-IrishScottishSeminoleSenegaleseSerbianShoshoneSierra LeoneanSiouxSlavicSlovakSloveneSomaliSouth AfricanSouth AmericanSouth American IndianSoviet UnionSpaniardSpanishSpanish AmericanSpanish American IndianSri LankanSubsaharan AfricanSudaneseSwedishSwissSyrianTaiwaneseThaiTlingit-HaidaTohono O'OdhamTonganTrinidadian and TobagonianTsimshianTurkishU.S. Virgin IslanderUgandanUkrainianUruguayanUteVenezuelanVietnameseWelshWest IndianYakamaYaquiYugoslavianYumanYup'ikZimbabwean
Immigration
NonimmigrantsImmigrantsAfghanistanAfricaAlbaniaArgentinaArmeniaAustraliaAustriaBahamasBangladeshBarbadosBelarusBelgiumBelizeBoliviaBosnia and HerzegovinaBrazilBulgariaBurma/MyanmarCabo VerdeCambodiaCameroonCanadaCaribbeanCentral AmericaChileChinaColombiaCongoCosta RicaCroatiaCubaCzechoslovakiaDenmarkDominicaDominican RepublicEastern AfricaEastern AsiaEastern EuropeEcuadorEgyptEl SalvadorEnglandEritreaEthiopiaEuropeFijiFranceGermanyGhanaGreeceGrenadaGuatemalaGuyanaHaitiHondurasHong KongHungaryIndiaIndonesiaIranIraqIrelandIsraelItalyJamaicaJapanJordanKazakhstanKenyaKoreaKuwaitLaosLatin AmericaLatviaLebanonLiberiaLithuaniaMalaysiaMexicoMicronesiaMiddle AfricaMoldovaMoroccoNepalNetherlandsNicaraguaNigeriaNorth AmericaNorth MacedoniaNorthern AfricaNorthern EuropeNorwayOceaniaPakistanPanamaPeruPhilippinesPolandPortugalRomaniaRussiaSaudi ArabiaScotlandSenegalSerbiaSierra LeoneSingaporeSomaliaSouth AfricaSouth AmericaSouth Central AsiaSouth Eastern AsiaSouthern EuropeSpainSri LankaSt. Vincent and the GrenadinesSudanSwedenSwitzerlandSyriaTaiwanThailandTrinidad and TobagoTurkeyUgandaUkraineUruguayUzbekistanVenezuelaVietnamWest IndiesWestern AfricaWestern AsiaWestern EuropeYemenZaireZimbabweAzores
12th Grade, No Diploma
Income
Poverty
Unemployment
Labor Participation
Family Structure
Vehicle Availability
Education Level
Disability

12th Grade, No Diploma Comparison

Immigrants from Asia

Russians

Good
Exceptional
91.3%
12TH GRADE, NO DIPLOMA
61.5/ 100
METRIC RATING
163rd/ 347
METRIC RANK
93.2%
12TH GRADE, NO DIPLOMA
99.9/ 100
METRIC RATING
26th/ 347
METRIC RANK

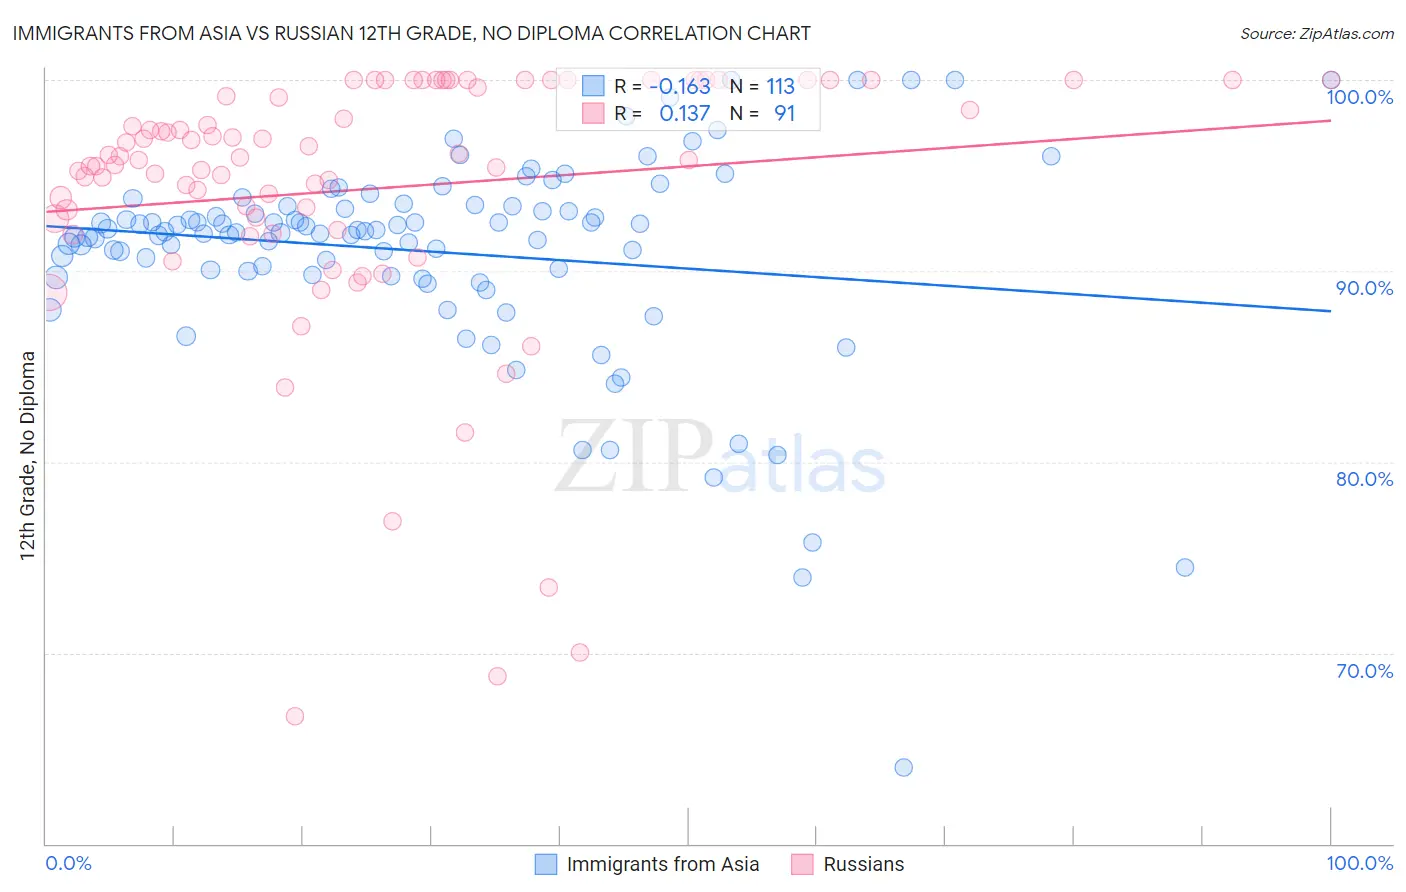
Immigrants from Asia vs Russian 12th Grade, No Diploma Correlation Chart

The statistical analysis conducted on geographies consisting of 549,170,397 people shows a poor negative correlation between the proportion of Immigrants from Asia and percentage of population with at least 12th grade (no diploma) education in the United States with a correlation coefficient (R) of -0.163 and weighted average of 91.3%. Similarly, the statistical analysis conducted on geographies consisting of 512,259,122 people shows a poor positive correlation between the proportion of Russians and percentage of population with at least 12th grade (no diploma) education in the United States with a correlation coefficient (R) of 0.137 and weighted average of 93.2%, a difference of 2.0%.
Immigrants from Asia vs Russian 12th Grade, No Diploma

12th Grade, No Diploma Correlation Summary

MeasurementImmigrants from AsiaRussian
Minimum64.0%66.7%
Maximum100.0%100.0%
Range36.0%33.3%
Mean91.0%94.3%
Median92.1%96.0%
Interquartile 25% (IQ1)89.9%92.7%
Interquartile 75% (IQ3)93.4%100.0%
Interquartile Range (IQR)3.5%7.3%
Standard Deviation (Sample)5.5%7.0%
Standard Deviation (Population)5.5%7.0%

Similar Demographics by 12th Grade, No Diploma

Demographics Similar to Immigrants from Asia by 12th Grade, No Diploma

In terms of 12th grade, no diploma, the demographic groups most similar to Immigrants from Asia are Brazilian (91.3%, a difference of 0.010%), Immigrants from China (91.3%, a difference of 0.010%), Immigrants from Albania (91.3%, a difference of 0.030%), Immigrants from Hong Kong (91.3%, a difference of 0.030%), and Laotian (91.3%, a difference of 0.040%).
DemographicsRating | Rank12th Grade, No Diploma
Asians
71.9
/100
|
#156
Good
91.4%
Immigrants | Pakistan
70.7
/100
|
#157
Good
91.4%
Immigrants | Northern Africa
66.2
/100
|
#158
Good
91.4%
Laotians
64.4
/100
|
#159
Good
91.3%
Immigrants | Albania
64.1
/100
|
#160
Good
91.3%
Immigrants | Hong Kong
63.8
/100
|
#161
Good
91.3%
Brazilians
62.0
/100
|
#162
Good
91.3%
Immigrants | Asia
61.5
/100
|
#163
Good
91.3%
Immigrants | China
60.9
/100
|
#164
Good
91.3%
Alsatians
58.3
/100
|
#165
Average
91.3%
Hmong
58.0
/100
|
#166
Average
91.3%
Immigrants | Malaysia
57.8
/100
|
#167
Average
91.3%
Cree
57.0
/100
|
#168
Average
91.2%
Immigrants | Indonesia
54.9
/100
|
#169
Average
91.2%
Delaware
52.8
/100
|
#170
Average
91.2%

Demographics Similar to Russians by 12th Grade, No Diploma

In terms of 12th grade, no diploma, the demographic groups most similar to Russians are Czech (93.2%, a difference of 0.0%), Cypriot (93.1%, a difference of 0.020%), Thai (93.2%, a difference of 0.030%), Scandinavian (93.2%, a difference of 0.040%), and Estonian (93.2%, a difference of 0.050%).
DemographicsRating | Rank12th Grade, No Diploma
Germans
99.9
/100
|
#19
Exceptional
93.3%
Filipinos
99.9
/100
|
#20
Exceptional
93.2%
Italians
99.9
/100
|
#21
Exceptional
93.2%
Estonians
99.9
/100
|
#22
Exceptional
93.2%
Scandinavians
99.9
/100
|
#23
Exceptional
93.2%
Thais
99.9
/100
|
#24
Exceptional
93.2%
Czechs
99.9
/100
|
#25
Exceptional
93.2%
Russians
99.9
/100
|
#26
Exceptional
93.2%
Cypriots
99.9
/100
|
#27
Exceptional
93.1%
Immigrants | Northern Europe
99.9
/100
|
#28
Exceptional
93.1%
Iranians
99.9
/100
|
#29
Exceptional
93.1%
Immigrants | Lithuania
99.9
/100
|
#30
Exceptional
93.1%
Immigrants | Ireland
99.9
/100
|
#31
Exceptional
93.1%
Europeans
99.9
/100
|
#32
Exceptional
93.1%
Immigrants | Scotland
99.9
/100
|
#33
Exceptional
93.0%