Immigrants from Asia vs Cape Verdean College, Under 1 year

COMPARE

Immigrants from Asia
Race
Ancestry
AfghanAfricanAlaska NativeAlaskan AthabascanAlbanianAleutAlsatianAmericanApacheArabArapahoArgentineanArmenianAssyrian/Chaldean/SyriacAustralianAustrianBahamianBangladeshiBarbadianBasqueBelgianBelizeanBermudanBhutaneseBlackfeetBolivianBrazilianBritishBritish West IndianBulgarianBurmeseCajunCambodianCanadianCarpatho RusynCelticCentral AmericanCentral American IndianCherokeeCheyenneChickasawChileanChineseChippewaChoctawColombianColvilleComancheCosta RicanCreeCreekCroatianCrowCubanCypriotCzechCzechoslovakianDanishDelawareDominicanDutchDutch West IndianEastern EuropeanEcuadorianEgyptianEnglishEstonianEthiopianEuropeanFijianFilipinoFinnishFrenchFrench American IndianFrench CanadianGermanGerman RussianGhanaianGreekGuamanian/ChamorroGuatemalanGuyaneseHaitianHmongHonduranHopiHoumaHungarianIcelanderIndian (Asian)IndonesianInupiatIranianIraqiIrishIroquoisIsraeliItalianJamaicanJapaneseJordanianKenyanKiowaKoreanLaotianLatvianLebaneseLiberianLithuanianLumbeeLuxembourgerMacedonianMalaysianMalteseMarshalleseMenomineeMexicanMexican American IndianMongolianMoroccanNative HawaiianNavajoNepaleseNew ZealanderNicaraguanNigerianNorthern EuropeanNorwegianOkinawanOsageOttawaPaiutePakistaniPalestinianPanamanianParaguayanPennsylvania GermanPeruvianPimaPolishPortuguesePotawatomiPuebloPuerto RicanPuget Sound SalishRomanianRussianSalvadoranSamoanScandinavianScotch-IrishScottishSeminoleSenegaleseSerbianShoshoneSierra LeoneanSiouxSlavicSlovakSloveneSomaliSouth AfricanSouth AmericanSouth American IndianSoviet UnionSpaniardSpanishSpanish AmericanSpanish American IndianSri LankanSubsaharan AfricanSudaneseSwedishSwissSyrianTaiwaneseThaiTlingit-HaidaTohono O'OdhamTonganTrinidadian and TobagonianTsimshianTurkishU.S. Virgin IslanderUgandanUkrainianUruguayanUteVenezuelanVietnameseWelshWest IndianYakamaYaquiYugoslavianYumanYup'ikZimbabwean
Immigration
NonimmigrantsImmigrantsAfghanistanAfricaAlbaniaArgentinaArmeniaAsiaAustraliaAustriaBahamasBangladeshBarbadosBelarusBelgiumBelizeBoliviaBosnia and HerzegovinaBrazilBulgariaBurma/MyanmarCabo VerdeCambodiaCameroonCanadaCaribbeanCentral AmericaChileChinaColombiaCongoCosta RicaCroatiaCubaCzechoslovakiaDenmarkDominicaDominican RepublicEastern AfricaEastern AsiaEastern EuropeEcuadorEgyptEl SalvadorEnglandEritreaEthiopiaEuropeFijiFranceGermanyGhanaGreeceGrenadaGuatemalaGuyanaHaitiHondurasHong KongHungaryIndiaIndonesiaIranIraqIrelandIsraelItalyJamaicaJapanJordanKazakhstanKenyaKoreaKuwaitLaosLatin AmericaLatviaLebanonLiberiaLithuaniaMalaysiaMexicoMicronesiaMiddle AfricaMoldovaMoroccoNepalNetherlandsNicaraguaNigeriaNorth AmericaNorth MacedoniaNorthern AfricaNorthern EuropeNorwayOceaniaPakistanPanamaPeruPhilippinesPolandPortugalRomaniaRussiaSaudi ArabiaScotlandSenegalSerbiaSierra LeoneSingaporeSomaliaSouth AfricaSouth AmericaSouth Central AsiaSouth Eastern AsiaSouthern EuropeSpainSri LankaSt. Vincent and the GrenadinesSudanSwedenSwitzerlandSyriaTaiwanThailandTrinidad and TobagoTurkeyUgandaUkraineUruguayUzbekistanVenezuelaVietnamWest IndiesWestern AfricaWestern AsiaWestern EuropeYemenZaireZimbabweAzores
Cape Verdean
Race
Ancestry
AfghanAfricanAlaska NativeAlaskan AthabascanAlbanianAleutAlsatianAmericanApacheArabArapahoArgentineanArmenianAssyrian/Chaldean/SyriacAustralianAustrianBahamianBangladeshiBarbadianBasqueBelgianBelizeanBermudanBhutaneseBlackfeetBolivianBrazilianBritishBritish West IndianBulgarianBurmeseCajunCambodianCanadianCape VerdeanCarpatho RusynCelticCentral AmericanCentral American IndianCherokeeCheyenneChickasawChileanChineseChippewaChoctawColombianColvilleComancheCosta RicanCreeCreekCroatianCrowCubanCypriotCzechCzechoslovakianDanishDelawareDominicanDutchDutch West IndianEastern EuropeanEcuadorianEgyptianEnglishEstonianEthiopianEuropeanFijianFilipinoFinnishFrenchFrench American IndianFrench CanadianGermanGerman RussianGhanaianGreekGuamanian/ChamorroGuatemalanGuyaneseHaitianHmongHonduranHopiHoumaHungarianIcelanderIndian (Asian)IndonesianInupiatIranianIraqiIrishIroquoisIsraeliItalianJamaicanJapaneseJordanianKenyanKiowaKoreanLaotianLatvianLebaneseLiberianLithuanianLumbeeLuxembourgerMacedonianMalaysianMalteseMarshalleseMenomineeMexicanMexican American IndianMongolianMoroccanNative HawaiianNavajoNepaleseNew ZealanderNicaraguanNigerianNorthern EuropeanNorwegianOkinawanOsageOttawaPaiutePakistaniPalestinianPanamanianParaguayanPennsylvania GermanPeruvianPimaPolishPortuguesePotawatomiPuebloPuerto RicanPuget Sound SalishRomanianRussianSalvadoranSamoanScandinavianScotch-IrishScottishSeminoleSenegaleseSerbianShoshoneSierra LeoneanSiouxSlavicSlovakSloveneSomaliSouth AfricanSouth AmericanSouth American IndianSoviet UnionSpaniardSpanishSpanish AmericanSpanish American IndianSri LankanSubsaharan AfricanSudaneseSwedishSwissSyrianTaiwaneseThaiTlingit-HaidaTohono O'OdhamTonganTrinidadian and TobagonianTsimshianTurkishU.S. Virgin IslanderUgandanUkrainianUruguayanUteVenezuelanVietnameseWelshWest IndianYakamaYaquiYugoslavianYumanYup'ikZimbabwean
Immigration
NonimmigrantsImmigrantsAfghanistanAfricaAlbaniaArgentinaArmeniaAustraliaAustriaBahamasBangladeshBarbadosBelarusBelgiumBelizeBoliviaBosnia and HerzegovinaBrazilBulgariaBurma/MyanmarCabo VerdeCambodiaCameroonCanadaCaribbeanCentral AmericaChileChinaColombiaCongoCosta RicaCroatiaCubaCzechoslovakiaDenmarkDominicaDominican RepublicEastern AfricaEastern AsiaEastern EuropeEcuadorEgyptEl SalvadorEnglandEritreaEthiopiaEuropeFijiFranceGermanyGhanaGreeceGrenadaGuatemalaGuyanaHaitiHondurasHong KongHungaryIndiaIndonesiaIranIraqIrelandIsraelItalyJamaicaJapanJordanKazakhstanKenyaKoreaKuwaitLaosLatin AmericaLatviaLebanonLiberiaLithuaniaMalaysiaMexicoMicronesiaMiddle AfricaMoldovaMoroccoNepalNetherlandsNicaraguaNigeriaNorth AmericaNorth MacedoniaNorthern AfricaNorthern EuropeNorwayOceaniaPakistanPanamaPeruPhilippinesPolandPortugalRomaniaRussiaSaudi ArabiaScotlandSenegalSerbiaSierra LeoneSingaporeSomaliaSouth AfricaSouth AmericaSouth Central AsiaSouth Eastern AsiaSouthern EuropeSpainSri LankaSt. Vincent and the GrenadinesSudanSwedenSwitzerlandSyriaTaiwanThailandTrinidad and TobagoTurkeyUgandaUkraineUruguayUzbekistanVenezuelaVietnamWest IndiesWestern AfricaWestern AsiaWestern EuropeYemenZaireZimbabweAzores
College, Under 1 year
Income
Poverty
Unemployment
Labor Participation
Family Structure
Vehicle Availability
Education Level
Disability

College, Under 1 year Comparison

Immigrants from Asia

Cape Verdeans

Exceptional
Tragic
69.2%
COLLEGE, UNDER 1 YEAR
99.5/ 100
METRIC RATING
60th/ 347
METRIC RANK
56.0%
COLLEGE, UNDER 1 YEAR
0.0/ 100
METRIC RATING
328th/ 347
METRIC RANK

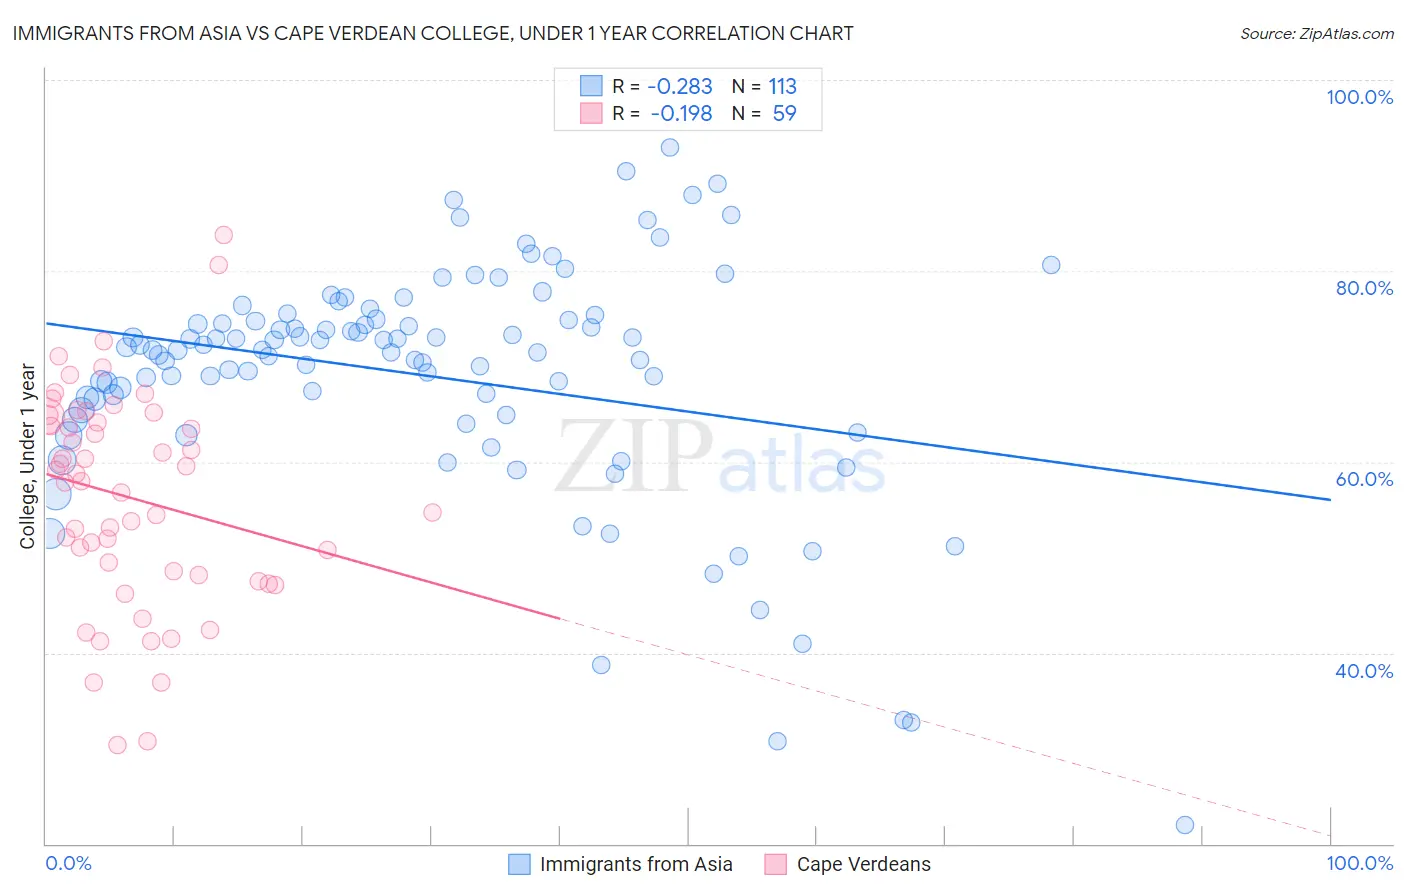
Immigrants from Asia vs Cape Verdean College, Under 1 year Correlation Chart

The statistical analysis conducted on geographies consisting of 549,165,526 people shows a weak negative correlation between the proportion of Immigrants from Asia and percentage of population with at least college, under 1 year education in the United States with a correlation coefficient (R) of -0.283 and weighted average of 69.2%. Similarly, the statistical analysis conducted on geographies consisting of 107,580,652 people shows a poor negative correlation between the proportion of Cape Verdeans and percentage of population with at least college, under 1 year education in the United States with a correlation coefficient (R) of -0.198 and weighted average of 56.0%, a difference of 23.5%.
Immigrants from Asia vs Cape Verdean College, Under 1 year

College, Under 1 year Correlation Summary

MeasurementImmigrants from AsiaCape Verdean
Minimum22.0%30.4%
Maximum92.9%83.7%
Range70.9%53.4%
Mean69.0%56.3%
Median71.7%58.0%
Interquartile 25% (IQ1)65.2%48.2%
Interquartile 75% (IQ3)74.9%64.8%
Interquartile Range (IQR)9.8%16.6%
Standard Deviation (Sample)12.4%11.3%
Standard Deviation (Population)12.4%11.2%

Similar Demographics by College, Under 1 year

Demographics Similar to Immigrants from Asia by College, Under 1 year

In terms of college, under 1 year, the demographic groups most similar to Immigrants from Asia are Immigrants from Kazakhstan (69.2%, a difference of 0.040%), Immigrants from Belarus (69.2%, a difference of 0.040%), Immigrants from Serbia (69.3%, a difference of 0.090%), Immigrants from Canada (69.1%, a difference of 0.17%), and Northern European (69.0%, a difference of 0.21%).
DemographicsRating | RankCollege, Under 1 year
South Africans
99.7
/100
|
#53
Exceptional
69.7%
Immigrants | Czechoslovakia
99.7
/100
|
#54
Exceptional
69.6%
Maltese
99.7
/100
|
#55
Exceptional
69.5%
Immigrants | Scotland
99.6
/100
|
#56
Exceptional
69.4%
Asians
99.6
/100
|
#57
Exceptional
69.4%
Immigrants | Malaysia
99.6
/100
|
#58
Exceptional
69.3%
Immigrants | Serbia
99.5
/100
|
#59
Exceptional
69.3%
Immigrants | Asia
99.5
/100
|
#60
Exceptional
69.2%
Immigrants | Kazakhstan
99.5
/100
|
#61
Exceptional
69.2%
Immigrants | Belarus
99.5
/100
|
#62
Exceptional
69.2%
Immigrants | Canada
99.4
/100
|
#63
Exceptional
69.1%
Northern Europeans
99.4
/100
|
#64
Exceptional
69.0%
Immigrants | Moldova
99.3
/100
|
#65
Exceptional
69.0%
Immigrants | North America
99.3
/100
|
#66
Exceptional
69.0%
Immigrants | Zimbabwe
99.2
/100
|
#67
Exceptional
68.9%

Demographics Similar to Cape Verdeans by College, Under 1 year

In terms of college, under 1 year, the demographic groups most similar to Cape Verdeans are Immigrants from Guatemala (56.2%, a difference of 0.29%), Navajo (56.3%, a difference of 0.38%), Immigrants from Latin America (56.3%, a difference of 0.53%), Immigrants from Cuba (55.7%, a difference of 0.62%), and Immigrants from El Salvador (56.4%, a difference of 0.63%).
DemographicsRating | RankCollege, Under 1 year
Natives/Alaskans
0.0
/100
|
#321
Tragic
56.6%
Immigrants | Caribbean
0.0
/100
|
#322
Tragic
56.6%
Immigrants | Honduras
0.0
/100
|
#323
Tragic
56.5%
Immigrants | El Salvador
0.0
/100
|
#324
Tragic
56.4%
Immigrants | Latin America
0.0
/100
|
#325
Tragic
56.3%
Navajo
0.0
/100
|
#326
Tragic
56.3%
Immigrants | Guatemala
0.0
/100
|
#327
Tragic
56.2%
Cape Verdeans
0.0
/100
|
#328
Tragic
56.0%
Immigrants | Cuba
0.0
/100
|
#329
Tragic
55.7%
Mexicans
0.0
/100
|
#330
Tragic
55.6%
Dominicans
0.0
/100
|
#331
Tragic
55.5%
Immigrants | Yemen
0.0
/100
|
#332
Tragic
55.3%
Yuman
0.0
/100
|
#333
Tragic
55.1%
Immigrants | Azores
0.0
/100
|
#334
Tragic
54.7%
Inupiat
0.0
/100
|
#335
Tragic
54.6%