Immigrants from Argentina vs Korean 11th Grade

COMPARE

Immigrants from Argentina
Race
Ancestry
AfghanAfricanAlaska NativeAlaskan AthabascanAlbanianAleutAlsatianAmericanApacheArabArapahoArgentineanArmenianAssyrian/Chaldean/SyriacAustralianAustrianBahamianBangladeshiBarbadianBasqueBelgianBelizeanBermudanBhutaneseBlackfeetBolivianBrazilianBritishBritish West IndianBulgarianBurmeseCajunCambodianCanadianCape VerdeanCarpatho RusynCelticCentral AmericanCentral American IndianCherokeeCheyenneChickasawChileanChineseChippewaChoctawColombianColvilleComancheCosta RicanCreeCreekCroatianCrowCubanCypriotCzechCzechoslovakianDanishDelawareDominicanDutchDutch West IndianEastern EuropeanEcuadorianEgyptianEnglishEstonianEthiopianEuropeanFijianFilipinoFinnishFrenchFrench American IndianFrench CanadianGermanGerman RussianGhanaianGreekGuamanian/ChamorroGuatemalanGuyaneseHaitianHmongHonduranHopiHoumaHungarianIcelanderIndian (Asian)IndonesianInupiatIranianIraqiIrishIroquoisIsraeliItalianJamaicanJapaneseJordanianKenyanKiowaLaotianLatvianLebaneseLiberianLithuanianLumbeeLuxembourgerMacedonianMalaysianMalteseMarshalleseMenomineeMexicanMexican American IndianMongolianMoroccanNative HawaiianNavajoNepaleseNew ZealanderNicaraguanNigerianNorthern EuropeanNorwegianOkinawanOsageOttawaPaiutePakistaniPalestinianPanamanianParaguayanPennsylvania GermanPeruvianPimaPolishPortuguesePotawatomiPuebloPuerto RicanPuget Sound SalishRomanianRussianSalvadoranSamoanScandinavianScotch-IrishScottishSeminoleSenegaleseSerbianShoshoneSierra LeoneanSiouxSlavicSlovakSloveneSomaliSouth AfricanSouth AmericanSouth American IndianSoviet UnionSpaniardSpanishSpanish AmericanSpanish American IndianSri LankanSubsaharan AfricanSudaneseSwedishSwissSyrianTaiwaneseThaiTlingit-HaidaTohono O'OdhamTonganTrinidadian and TobagonianTsimshianTurkishU.S. Virgin IslanderUgandanUkrainianUruguayanUteVenezuelanVietnameseWelshWest IndianYakamaYaquiYugoslavianYumanYup'ikZimbabwean
Immigration
NonimmigrantsImmigrantsAfghanistanAfricaAlbaniaArgentinaArmeniaAsiaAustraliaAustriaBahamasBangladeshBarbadosBelarusBelgiumBelizeBoliviaBosnia and HerzegovinaBrazilBulgariaBurma/MyanmarCabo VerdeCambodiaCameroonCanadaCaribbeanCentral AmericaChileChinaColombiaCongoCosta RicaCroatiaCubaCzechoslovakiaDenmarkDominicaDominican RepublicEastern AfricaEastern AsiaEastern EuropeEcuadorEgyptEl SalvadorEnglandEritreaEthiopiaEuropeFijiFranceGermanyGhanaGreeceGrenadaGuatemalaGuyanaHaitiHondurasHong KongHungaryIndiaIndonesiaIranIraqIrelandIsraelItalyJamaicaJapanJordanKazakhstanKenyaKoreaKuwaitLaosLatin AmericaLatviaLebanonLiberiaLithuaniaMalaysiaMexicoMicronesiaMiddle AfricaMoldovaMoroccoNepalNetherlandsNicaraguaNigeriaNorth AmericaNorth MacedoniaNorthern AfricaNorthern EuropeNorwayOceaniaPakistanPanamaPeruPhilippinesPolandPortugalRomaniaRussiaSaudi ArabiaScotlandSenegalSerbiaSierra LeoneSingaporeSomaliaSouth AfricaSouth AmericaSouth Central AsiaSouth Eastern AsiaSouthern EuropeSpainSri LankaSt. Vincent and the GrenadinesSudanSwedenSwitzerlandSyriaTaiwanThailandTrinidad and TobagoTurkeyUgandaUkraineUruguayUzbekistanVenezuelaVietnamWest IndiesWestern AfricaWestern AsiaWestern EuropeYemenZaireZimbabweAzores
Korean
Race
Ancestry
AfghanAfricanAlaska NativeAlaskan AthabascanAlbanianAleutAlsatianAmericanApacheArabArapahoArgentineanArmenianAssyrian/Chaldean/SyriacAustralianAustrianBahamianBangladeshiBarbadianBasqueBelgianBelizeanBermudanBhutaneseBlackfeetBolivianBrazilianBritishBritish West IndianBulgarianBurmeseCajunCambodianCanadianCape VerdeanCarpatho RusynCelticCentral AmericanCentral American IndianCherokeeCheyenneChickasawChileanChineseChippewaChoctawColombianColvilleComancheCosta RicanCreeCreekCroatianCrowCubanCypriotCzechCzechoslovakianDanishDelawareDominicanDutchDutch West IndianEastern EuropeanEcuadorianEgyptianEnglishEstonianEthiopianEuropeanFijianFilipinoFinnishFrenchFrench American IndianFrench CanadianGermanGerman RussianGhanaianGreekGuamanian/ChamorroGuatemalanGuyaneseHaitianHmongHonduranHopiHoumaHungarianIcelanderIndian (Asian)IndonesianInupiatIranianIraqiIrishIroquoisIsraeliItalianJamaicanJapaneseJordanianKenyanKiowaKoreanLaotianLatvianLebaneseLiberianLithuanianLumbeeLuxembourgerMacedonianMalaysianMalteseMarshalleseMenomineeMexicanMexican American IndianMongolianMoroccanNative HawaiianNavajoNepaleseNew ZealanderNicaraguanNigerianNorthern EuropeanNorwegianOkinawanOsageOttawaPaiutePakistaniPalestinianPanamanianParaguayanPennsylvania GermanPeruvianPimaPolishPortuguesePotawatomiPuebloPuerto RicanPuget Sound SalishRomanianRussianSalvadoranSamoanScandinavianScotch-IrishScottishSeminoleSenegaleseSerbianShoshoneSierra LeoneanSiouxSlavicSlovakSloveneSomaliSouth AfricanSouth AmericanSouth American IndianSoviet UnionSpaniardSpanishSpanish AmericanSpanish American IndianSri LankanSubsaharan AfricanSudaneseSwedishSwissSyrianTaiwaneseThaiTlingit-HaidaTohono O'OdhamTonganTrinidadian and TobagonianTsimshianTurkishU.S. Virgin IslanderUgandanUkrainianUruguayanUteVenezuelanVietnameseWelshWest IndianYakamaYaquiYugoslavianYumanYup'ikZimbabwean
Immigration
NonimmigrantsImmigrantsAfghanistanAfricaAlbaniaArmeniaAsiaAustraliaAustriaBahamasBangladeshBarbadosBelarusBelgiumBelizeBoliviaBosnia and HerzegovinaBrazilBulgariaBurma/MyanmarCabo VerdeCambodiaCameroonCanadaCaribbeanCentral AmericaChileChinaColombiaCongoCosta RicaCroatiaCubaCzechoslovakiaDenmarkDominicaDominican RepublicEastern AfricaEastern AsiaEastern EuropeEcuadorEgyptEl SalvadorEnglandEritreaEthiopiaEuropeFijiFranceGermanyGhanaGreeceGrenadaGuatemalaGuyanaHaitiHondurasHong KongHungaryIndiaIndonesiaIranIraqIrelandIsraelItalyJamaicaJapanJordanKazakhstanKenyaKoreaKuwaitLaosLatin AmericaLatviaLebanonLiberiaLithuaniaMalaysiaMexicoMicronesiaMiddle AfricaMoldovaMoroccoNepalNetherlandsNicaraguaNigeriaNorth AmericaNorth MacedoniaNorthern AfricaNorthern EuropeNorwayOceaniaPakistanPanamaPeruPhilippinesPolandPortugalRomaniaRussiaSaudi ArabiaScotlandSenegalSerbiaSierra LeoneSingaporeSomaliaSouth AfricaSouth AmericaSouth Central AsiaSouth Eastern AsiaSouthern EuropeSpainSri LankaSt. Vincent and the GrenadinesSudanSwedenSwitzerlandSyriaTaiwanThailandTrinidad and TobagoTurkeyUgandaUkraineUruguayUzbekistanVenezuelaVietnamWest IndiesWestern AfricaWestern AsiaWestern EuropeYemenZaireZimbabweAzores
11th Grade
Income
Poverty
Unemployment
Labor Participation
Family Structure
Vehicle Availability
Education Level
Disability

11th Grade Comparison

Immigrants from Argentina

Koreans

Good
Poor
92.7%
11TH GRADE
69.8/ 100
METRIC RATING
161st/ 347
METRIC RANK
92.1%
11TH GRADE
14.4/ 100
METRIC RATING
212th/ 347
METRIC RANK

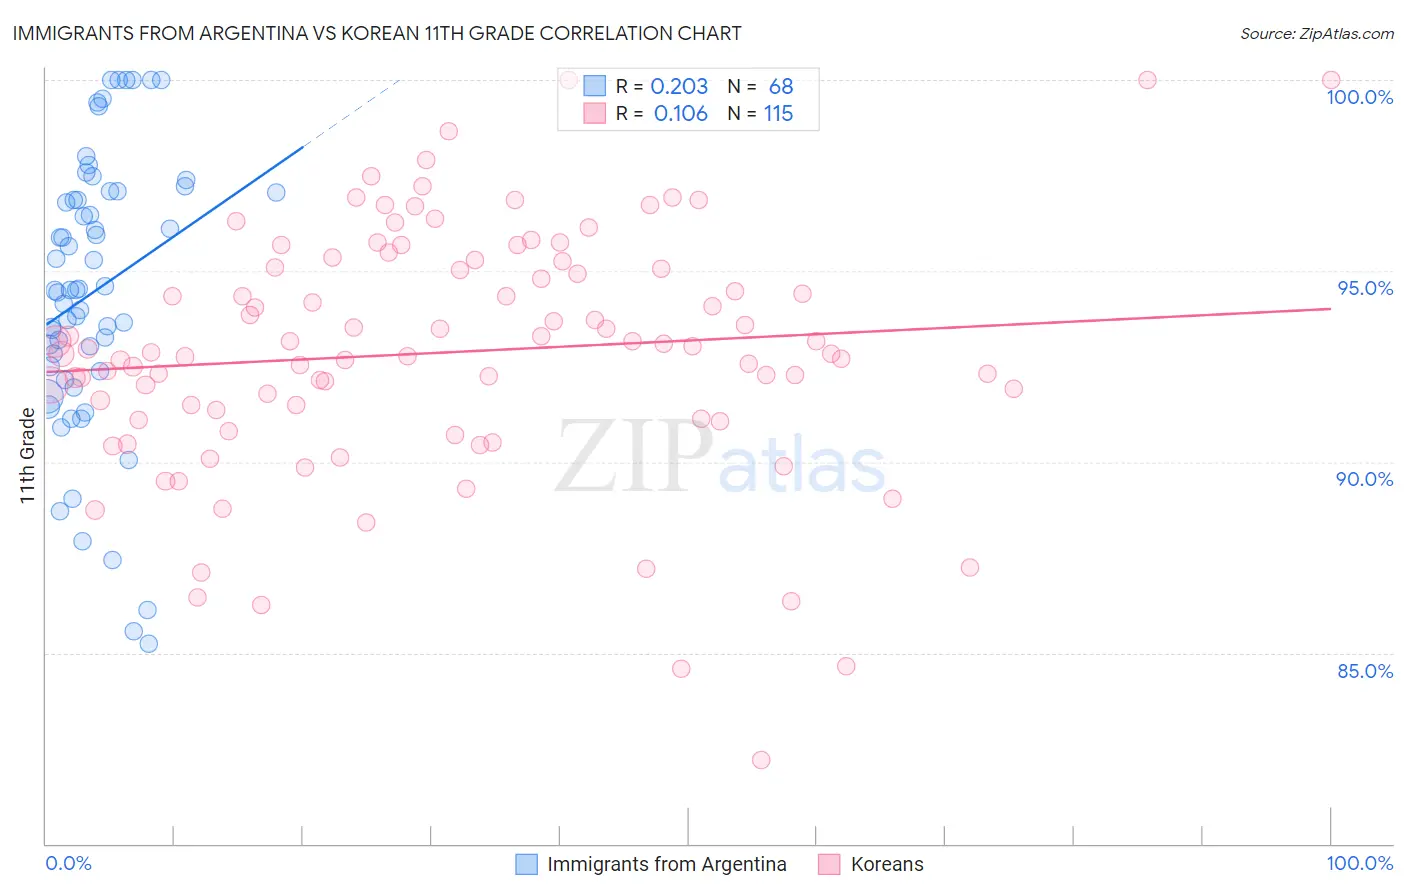
Immigrants from Argentina vs Korean 11th Grade Correlation Chart

The statistical analysis conducted on geographies consisting of 264,436,618 people shows a weak positive correlation between the proportion of Immigrants from Argentina and percentage of population with at least 11th grade education in the United States with a correlation coefficient (R) of 0.203 and weighted average of 92.7%. Similarly, the statistical analysis conducted on geographies consisting of 510,943,943 people shows a poor positive correlation between the proportion of Koreans and percentage of population with at least 11th grade education in the United States with a correlation coefficient (R) of 0.106 and weighted average of 92.1%, a difference of 0.65%.
Immigrants from Argentina vs Korean 11th Grade

11th Grade Correlation Summary

MeasurementImmigrants from ArgentinaKorean
Minimum85.2%82.2%
Maximum100.0%100.0%
Range14.8%17.8%
Mean94.5%92.9%
Median94.5%92.9%
Interquartile 25% (IQ1)92.4%91.1%
Interquartile 75% (IQ3)97.1%95.1%
Interquartile Range (IQR)4.6%3.9%
Standard Deviation (Sample)3.6%3.2%
Standard Deviation (Population)3.6%3.2%

Similar Demographics by 11th Grade

Demographics Similar to Immigrants from Argentina by 11th Grade

In terms of 11th grade, the demographic groups most similar to Immigrants from Argentina are Immigrants from Lebanon (92.7%, a difference of 0.010%), Paraguayan (92.7%, a difference of 0.010%), American (92.7%, a difference of 0.020%), Immigrants from Eastern Asia (92.7%, a difference of 0.030%), and Immigrants from Venezuela (92.7%, a difference of 0.030%).
DemographicsRating | Rank11th Grade
Osage
73.4
/100
|
#154
Good
92.7%
Argentineans
73.4
/100
|
#155
Good
92.7%
Immigrants | Spain
73.0
/100
|
#156
Good
92.7%
Immigrants | Eastern Asia
72.6
/100
|
#157
Good
92.7%
Immigrants | Venezuela
72.0
/100
|
#158
Good
92.7%
Americans
71.7
/100
|
#159
Good
92.7%
Immigrants | Lebanon
70.7
/100
|
#160
Good
92.7%
Immigrants | Argentina
69.8
/100
|
#161
Good
92.7%
Paraguayans
68.7
/100
|
#162
Good
92.7%
Immigrants | Nonimmigrants
66.6
/100
|
#163
Good
92.7%
Spanish
66.2
/100
|
#164
Good
92.7%
Immigrants | Iraq
63.7
/100
|
#165
Good
92.6%
Bermudans
62.3
/100
|
#166
Good
92.6%
Alsatians
60.2
/100
|
#167
Good
92.6%
Sierra Leoneans
58.7
/100
|
#168
Average
92.6%

Demographics Similar to Koreans by 11th Grade

In terms of 11th grade, the demographic groups most similar to Koreans are Immigrants from Ethiopia (92.1%, a difference of 0.010%), Afghan (92.1%, a difference of 0.030%), Immigrants from Southern Europe (92.1%, a difference of 0.040%), Immigrants from Micronesia (92.2%, a difference of 0.060%), and Somali (92.1%, a difference of 0.060%).
DemographicsRating | Rank11th Grade
Kiowa
23.2
/100
|
#205
Fair
92.2%
Bolivians
23.2
/100
|
#206
Fair
92.2%
Immigrants | Oceania
22.4
/100
|
#207
Fair
92.2%
Colville
21.8
/100
|
#208
Fair
92.2%
Tongans
19.8
/100
|
#209
Poor
92.2%
Ethiopians
18.8
/100
|
#210
Poor
92.2%
Immigrants | Micronesia
17.7
/100
|
#211
Poor
92.2%
Koreans
14.4
/100
|
#212
Poor
92.1%
Immigrants | Ethiopia
13.9
/100
|
#213
Poor
92.1%
Afghans
12.8
/100
|
#214
Poor
92.1%
Immigrants | Southern Europe
12.5
/100
|
#215
Poor
92.1%
Somalis
11.6
/100
|
#216
Poor
92.1%
Immigrants | Sierra Leone
11.1
/100
|
#217
Poor
92.0%
Blackfeet
10.1
/100
|
#218
Poor
92.0%
Portuguese
10.0
/100
|
#219
Tragic
92.0%