Guamanian/Chamorro vs Arab 9th Grade

COMPARE

Guamanian/Chamorro
Race
Ancestry
AfghanAfricanAlaska NativeAlaskan AthabascanAlbanianAleutAlsatianAmericanApacheArapahoArgentineanArmenianAssyrian/Chaldean/SyriacAustralianAustrianBahamianBangladeshiBarbadianBasqueBelgianBelizeanBermudanBhutaneseBlackfeetBolivianBrazilianBritishBritish West IndianBulgarianBurmeseCajunCambodianCanadianCape VerdeanCarpatho RusynCelticCentral AmericanCentral American IndianCherokeeCheyenneChickasawChileanChineseChippewaChoctawColombianColvilleComancheCosta RicanCreeCreekCroatianCrowCubanCypriotCzechCzechoslovakianDanishDelawareDominicanDutchDutch West IndianEastern EuropeanEcuadorianEgyptianEnglishEstonianEthiopianEuropeanFijianFilipinoFinnishFrenchFrench American IndianFrench CanadianGermanGerman RussianGhanaianGreekGuamanian/ChamorroGuatemalanGuyaneseHaitianHmongHonduranHopiHoumaHungarianIcelanderIndian (Asian)IndonesianInupiatIranianIraqiIrishIroquoisIsraeliItalianJamaicanJapaneseJordanianKenyanKiowaKoreanLaotianLatvianLebaneseLiberianLithuanianLumbeeLuxembourgerMacedonianMalaysianMalteseMarshalleseMenomineeMexicanMexican American IndianMongolianMoroccanNative HawaiianNavajoNepaleseNew ZealanderNicaraguanNigerianNorthern EuropeanNorwegianOkinawanOsageOttawaPaiutePakistaniPalestinianPanamanianParaguayanPennsylvania GermanPeruvianPimaPolishPortuguesePotawatomiPuebloPuerto RicanPuget Sound SalishRomanianRussianSalvadoranSamoanScandinavianScotch-IrishScottishSeminoleSenegaleseSerbianShoshoneSierra LeoneanSiouxSlavicSlovakSloveneSomaliSouth AfricanSouth AmericanSouth American IndianSoviet UnionSpaniardSpanishSpanish AmericanSpanish American IndianSri LankanSubsaharan AfricanSudaneseSwedishSwissSyrianTaiwaneseThaiTlingit-HaidaTohono O'OdhamTonganTrinidadian and TobagonianTsimshianTurkishU.S. Virgin IslanderUgandanUkrainianUruguayanUteVenezuelanVietnameseWelshWest IndianYakamaYaquiYugoslavianYumanYup'ikZimbabwean
Immigration
NonimmigrantsImmigrantsAfghanistanAfricaAlbaniaArgentinaArmeniaAsiaAustraliaAustriaBahamasBangladeshBarbadosBelarusBelgiumBelizeBoliviaBosnia and HerzegovinaBrazilBulgariaBurma/MyanmarCabo VerdeCambodiaCameroonCanadaCaribbeanCentral AmericaChileChinaColombiaCongoCosta RicaCroatiaCubaCzechoslovakiaDenmarkDominicaDominican RepublicEastern AfricaEastern AsiaEastern EuropeEcuadorEgyptEl SalvadorEnglandEritreaEthiopiaEuropeFijiFranceGermanyGhanaGreeceGrenadaGuatemalaGuyanaHaitiHondurasHong KongHungaryIndiaIndonesiaIranIraqIrelandIsraelItalyJamaicaJapanJordanKazakhstanKenyaKoreaKuwaitLaosLatin AmericaLatviaLebanonLiberiaLithuaniaMalaysiaMexicoMicronesiaMiddle AfricaMoldovaMoroccoNepalNetherlandsNicaraguaNigeriaNorth AmericaNorth MacedoniaNorthern AfricaNorthern EuropeNorwayOceaniaPakistanPanamaPeruPhilippinesPolandPortugalRomaniaRussiaSaudi ArabiaScotlandSenegalSerbiaSierra LeoneSingaporeSomaliaSouth AfricaSouth AmericaSouth Central AsiaSouth Eastern AsiaSouthern EuropeSpainSri LankaSt. Vincent and the GrenadinesSudanSwedenSwitzerlandSyriaTaiwanThailandTrinidad and TobagoTurkeyUgandaUkraineUruguayUzbekistanVenezuelaVietnamWest IndiesWestern AfricaWestern AsiaWestern EuropeYemenZaireZimbabweAzores
Arab
Race
Ancestry
AfghanAfricanAlaska NativeAlaskan AthabascanAlbanianAleutAlsatianAmericanApacheArabArapahoArgentineanArmenianAssyrian/Chaldean/SyriacAustralianAustrianBahamianBangladeshiBarbadianBasqueBelgianBelizeanBermudanBhutaneseBlackfeetBolivianBrazilianBritishBritish West IndianBulgarianBurmeseCajunCambodianCanadianCape VerdeanCarpatho RusynCelticCentral AmericanCentral American IndianCherokeeCheyenneChickasawChileanChineseChippewaChoctawColombianColvilleComancheCosta RicanCreeCreekCroatianCrowCubanCypriotCzechCzechoslovakianDanishDelawareDominicanDutchDutch West IndianEastern EuropeanEcuadorianEgyptianEnglishEstonianEthiopianEuropeanFijianFilipinoFinnishFrenchFrench American IndianFrench CanadianGermanGerman RussianGhanaianGreekGuatemalanGuyaneseHaitianHmongHonduranHopiHoumaHungarianIcelanderIndian (Asian)IndonesianInupiatIranianIraqiIrishIroquoisIsraeliItalianJamaicanJapaneseJordanianKenyanKiowaKoreanLaotianLatvianLebaneseLiberianLithuanianLumbeeLuxembourgerMacedonianMalaysianMalteseMarshalleseMenomineeMexicanMexican American IndianMongolianMoroccanNative HawaiianNavajoNepaleseNew ZealanderNicaraguanNigerianNorthern EuropeanNorwegianOkinawanOsageOttawaPaiutePakistaniPalestinianPanamanianParaguayanPennsylvania GermanPeruvianPimaPolishPortuguesePotawatomiPuebloPuerto RicanPuget Sound SalishRomanianRussianSalvadoranSamoanScandinavianScotch-IrishScottishSeminoleSenegaleseSerbianShoshoneSierra LeoneanSiouxSlavicSlovakSloveneSomaliSouth AfricanSouth AmericanSouth American IndianSoviet UnionSpaniardSpanishSpanish AmericanSpanish American IndianSri LankanSubsaharan AfricanSudaneseSwedishSwissSyrianTaiwaneseThaiTlingit-HaidaTohono O'OdhamTonganTrinidadian and TobagonianTsimshianTurkishU.S. Virgin IslanderUgandanUkrainianUruguayanUteVenezuelanVietnameseWelshWest IndianYakamaYaquiYugoslavianYumanYup'ikZimbabwean
Immigration
NonimmigrantsImmigrantsAfghanistanAfricaAlbaniaArgentinaArmeniaAsiaAustraliaAustriaBahamasBangladeshBarbadosBelarusBelgiumBelizeBoliviaBosnia and HerzegovinaBrazilBulgariaBurma/MyanmarCabo VerdeCambodiaCameroonCanadaCaribbeanCentral AmericaChileChinaColombiaCongoCosta RicaCroatiaCubaCzechoslovakiaDenmarkDominicaDominican RepublicEastern AfricaEastern AsiaEastern EuropeEcuadorEgyptEl SalvadorEnglandEritreaEthiopiaEuropeFijiFranceGermanyGhanaGreeceGrenadaGuatemalaGuyanaHaitiHondurasHong KongHungaryIndiaIndonesiaIranIraqIrelandIsraelItalyJamaicaJapanJordanKazakhstanKenyaKoreaKuwaitLaosLatin AmericaLatviaLebanonLiberiaLithuaniaMalaysiaMexicoMicronesiaMiddle AfricaMoldovaMoroccoNepalNetherlandsNicaraguaNigeriaNorth AmericaNorth MacedoniaNorthern AfricaNorthern EuropeNorwayOceaniaPakistanPanamaPeruPhilippinesPolandPortugalRomaniaRussiaSaudi ArabiaScotlandSenegalSerbiaSierra LeoneSingaporeSomaliaSouth AfricaSouth AmericaSouth Central AsiaSouth Eastern AsiaSouthern EuropeSpainSri LankaSt. Vincent and the GrenadinesSudanSwedenSwitzerlandSyriaTaiwanThailandTrinidad and TobagoTurkeyUgandaUkraineUruguayUzbekistanVenezuelaVietnamWest IndiesWestern AfricaWestern AsiaWestern EuropeYemenZaireZimbabweAzores
9th Grade
Income
Poverty
Unemployment
Labor Participation
Family Structure
Vehicle Availability
Education Level
Disability

9th Grade Comparison

Guamanians/Chamorros

Arabs

Fair
Good
94.8%
9TH GRADE
35.5/ 100
METRIC RATING
187th/ 347
METRIC RANK
95.1%
9TH GRADE
74.9/ 100
METRIC RATING
154th/ 347
METRIC RANK

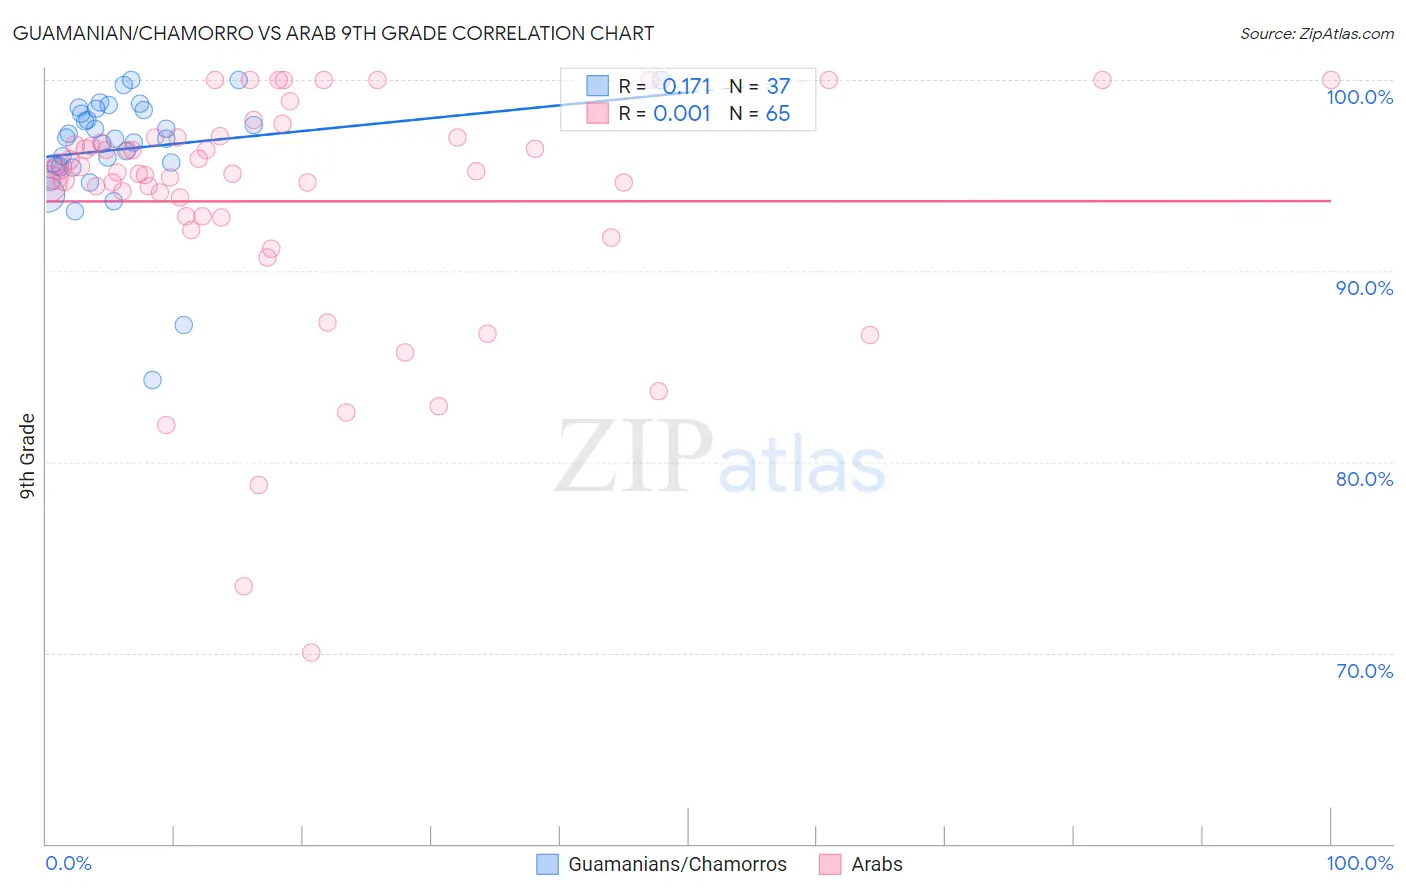
Guamanian/Chamorro vs Arab 9th Grade Correlation Chart

The statistical analysis conducted on geographies consisting of 221,965,618 people shows a poor positive correlation between the proportion of Guamanians/Chamorros and percentage of population with at least 9th grade education in the United States with a correlation coefficient (R) of 0.171 and weighted average of 94.8%. Similarly, the statistical analysis conducted on geographies consisting of 486,871,007 people shows no correlation between the proportion of Arabs and percentage of population with at least 9th grade education in the United States with a correlation coefficient (R) of 0.001 and weighted average of 95.1%, a difference of 0.31%.
Guamanian/Chamorro vs Arab 9th Grade

9th Grade Correlation Summary

MeasurementGuamanian/ChamorroArab
Minimum84.3%70.0%
Maximum100.0%100.0%
Range15.7%30.0%
Mean96.4%93.6%
Median96.9%95.1%
Interquartile 25% (IQ1)95.5%92.8%
Interquartile 75% (IQ3)98.5%97.0%
Interquartile Range (IQR)3.0%4.2%
Standard Deviation (Sample)3.2%6.3%
Standard Deviation (Population)3.1%6.2%

Similar Demographics by 9th Grade

Demographics Similar to Guamanians/Chamorros by 9th Grade

In terms of 9th grade, the demographic groups most similar to Guamanians/Chamorros are Hopi (94.8%, a difference of 0.010%), Immigrants from Albania (94.8%, a difference of 0.010%), Immigrants from Argentina (94.8%, a difference of 0.010%), Argentinean (94.8%, a difference of 0.020%), and Liberian (94.8%, a difference of 0.020%).
DemographicsRating | Rank9th Grade
Immigrants | Uganda
43.1
/100
|
#180
Average
94.8%
Sierra Leoneans
42.7
/100
|
#181
Average
94.8%
Seminole
42.5
/100
|
#182
Average
94.8%
Immigrants | Nepal
39.7
/100
|
#183
Fair
94.8%
Argentineans
37.6
/100
|
#184
Fair
94.8%
Liberians
37.4
/100
|
#185
Fair
94.8%
Hopi
37.1
/100
|
#186
Fair
94.8%
Guamanians/Chamorros
35.5
/100
|
#187
Fair
94.8%
Immigrants | Albania
34.5
/100
|
#188
Fair
94.8%
Immigrants | Argentina
34.4
/100
|
#189
Fair
94.8%
Sudanese
32.7
/100
|
#190
Fair
94.7%
Assyrians/Chaldeans/Syriacs
32.0
/100
|
#191
Fair
94.7%
Immigrants | Northern Africa
30.7
/100
|
#192
Fair
94.7%
Paraguayans
30.1
/100
|
#193
Fair
94.7%
Panamanians
29.0
/100
|
#194
Fair
94.7%

Demographics Similar to Arabs by 9th Grade

In terms of 9th grade, the demographic groups most similar to Arabs are Immigrants from Kazakhstan (95.1%, a difference of 0.0%), Albanian (95.1%, a difference of 0.010%), Ugandan (95.1%, a difference of 0.020%), Immigrants from Kenya (95.0%, a difference of 0.020%), and Mongolian (95.0%, a difference of 0.020%).
DemographicsRating | Rank9th Grade
Choctaw
81.9
/100
|
#147
Excellent
95.1%
Immigrants | Jordan
81.2
/100
|
#148
Excellent
95.1%
Immigrants | Korea
79.6
/100
|
#149
Good
95.1%
Kenyans
79.1
/100
|
#150
Good
95.1%
Cajuns
77.3
/100
|
#151
Good
95.1%
Ugandans
77.0
/100
|
#152
Good
95.1%
Albanians
76.1
/100
|
#153
Good
95.1%
Arabs
74.9
/100
|
#154
Good
95.1%
Immigrants | Kazakhstan
74.7
/100
|
#155
Good
95.1%
Immigrants | Kenya
73.1
/100
|
#156
Good
95.0%
Mongolians
73.0
/100
|
#157
Good
95.0%
Egyptians
70.1
/100
|
#158
Good
95.0%
Immigrants | Ukraine
67.4
/100
|
#159
Good
95.0%
Immigrants | Italy
66.6
/100
|
#160
Good
95.0%
French American Indians
66.5
/100
|
#161
Good
95.0%