Guamanian/Chamorro vs Arab Disability Age Over 75
COMPARE
Guamanian/Chamorro
Arab
Disability Age Over 75
Disability Age Over 75 Comparison
Guamanians/Chamorros
Arabs
49.4%
DISABILITY AGE OVER 75
0.0/ 100
METRIC RATING
279th/ 347
METRIC RANK
47.1%
DISABILITY AGE OVER 75
73.3/ 100
METRIC RATING
156th/ 347
METRIC RANK
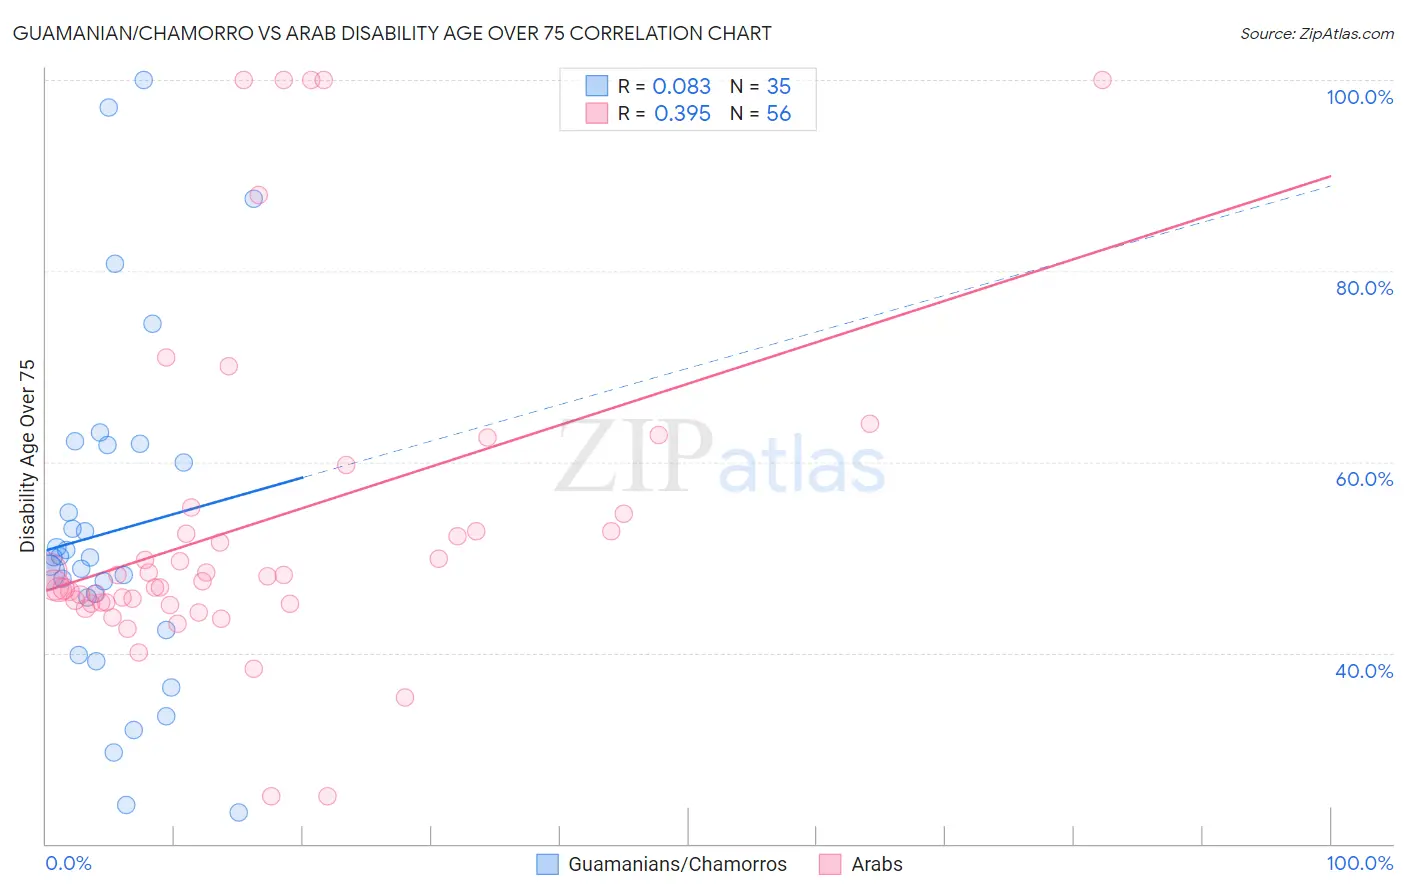
Guamanian/Chamorro vs Arab Disability Age Over 75 Correlation Chart
The statistical analysis conducted on geographies consisting of 221,408,393 people shows a slight positive correlation between the proportion of Guamanians/Chamorros and percentage of population with a disability over the age of 75 in the United States with a correlation coefficient (R) of 0.083 and weighted average of 49.4%. Similarly, the statistical analysis conducted on geographies consisting of 485,582,526 people shows a mild positive correlation between the proportion of Arabs and percentage of population with a disability over the age of 75 in the United States with a correlation coefficient (R) of 0.395 and weighted average of 47.1%, a difference of 4.9%.
Disability Age Over 75 Correlation Summary
| Measurement | Guamanian/Chamorro | Arab |
| Minimum | 23.3% | 25.0% |
| Maximum | 100.0% | 100.0% |
| Range | 76.7% | 75.0% |
| Mean | 52.7% | 53.5% |
| Median | 50.0% | 47.8% |
| Interquartile 25% (IQ1) | 42.4% | 45.2% |
| Interquartile 75% (IQ3) | 61.7% | 53.7% |
| Interquartile Range (IQR) | 19.3% | 8.5% |
| Standard Deviation (Sample) | 18.1% | 17.6% |
| Standard Deviation (Population) | 17.8% | 17.4% |
Similar Demographics by Disability Age Over 75
Demographics Similar to Guamanians/Chamorros by Disability Age Over 75
In terms of disability age over 75, the demographic groups most similar to Guamanians/Chamorros are Bangladeshi (49.4%, a difference of 0.060%), Belizean (49.4%, a difference of 0.070%), Black/African American (49.5%, a difference of 0.21%), Samoan (49.5%, a difference of 0.24%), and Immigrants from Latin America (49.5%, a difference of 0.29%).
| Demographics | Rating | Rank | Disability Age Over 75 |
| Assyrians/Chaldeans/Syriacs | 0.2 /100 | #272 | Tragic 49.1% |
| Immigrants | Iraq | 0.1 /100 | #273 | Tragic 49.1% |
| Immigrants | Guatemala | 0.1 /100 | #274 | Tragic 49.1% |
| Immigrants | Dominica | 0.1 /100 | #275 | Tragic 49.1% |
| Immigrants | Uzbekistan | 0.1 /100 | #276 | Tragic 49.2% |
| Hawaiians | 0.1 /100 | #277 | Tragic 49.2% |
| Immigrants | Laos | 0.1 /100 | #278 | Tragic 49.2% |
| Guamanians/Chamorros | 0.0 /100 | #279 | Tragic 49.4% |
| Bangladeshis | 0.0 /100 | #280 | Tragic 49.4% |
| Belizeans | 0.0 /100 | #281 | Tragic 49.4% |
| Blacks/African Americans | 0.0 /100 | #282 | Tragic 49.5% |
| Samoans | 0.0 /100 | #283 | Tragic 49.5% |
| Immigrants | Latin America | 0.0 /100 | #284 | Tragic 49.5% |
| Crow | 0.0 /100 | #285 | Tragic 49.6% |
| Immigrants | Belize | 0.0 /100 | #286 | Tragic 49.6% |
Demographics Similar to Arabs by Disability Age Over 75
In terms of disability age over 75, the demographic groups most similar to Arabs are Bhutanese (47.1%, a difference of 0.020%), Immigrants from Zaire (47.1%, a difference of 0.040%), Immigrants from Belarus (47.1%, a difference of 0.040%), Immigrants from Iran (47.1%, a difference of 0.040%), and Immigrants from Guyana (47.1%, a difference of 0.040%).
| Demographics | Rating | Rank | Disability Age Over 75 |
| Welsh | 81.3 /100 | #149 | Excellent 47.0% |
| Immigrants | Russia | 79.3 /100 | #150 | Good 47.0% |
| French Canadians | 79.0 /100 | #151 | Good 47.0% |
| Immigrants | Asia | 76.5 /100 | #152 | Good 47.0% |
| Immigrants | Zaire | 74.8 /100 | #153 | Good 47.1% |
| Immigrants | Belarus | 74.8 /100 | #154 | Good 47.1% |
| Immigrants | Iran | 74.7 /100 | #155 | Good 47.1% |
| Arabs | 73.3 /100 | #156 | Good 47.1% |
| Bhutanese | 72.6 /100 | #157 | Good 47.1% |
| Immigrants | Guyana | 71.9 /100 | #158 | Good 47.1% |
| Immigrants | Morocco | 71.4 /100 | #159 | Good 47.1% |
| Immigrants | Middle Africa | 68.3 /100 | #160 | Good 47.1% |
| South American Indians | 68.1 /100 | #161 | Good 47.1% |
| Pennsylvania Germans | 66.0 /100 | #162 | Good 47.2% |
| Immigrants | Eastern Africa | 65.5 /100 | #163 | Good 47.2% |