Ghanaian vs Costa Rican 11th Grade

COMPARE

Ghanaian
Race
Ancestry
AfghanAfricanAlaska NativeAlaskan AthabascanAlbanianAleutAlsatianAmericanApacheArabArapahoArgentineanArmenianAssyrian/Chaldean/SyriacAustralianAustrianBahamianBangladeshiBarbadianBasqueBelgianBelizeanBermudanBhutaneseBlackfeetBolivianBrazilianBritishBritish West IndianBulgarianBurmeseCajunCambodianCanadianCape VerdeanCarpatho RusynCelticCentral AmericanCentral American IndianCherokeeCheyenneChickasawChileanChineseChippewaChoctawColombianColvilleComancheCreeCreekCroatianCrowCubanCypriotCzechCzechoslovakianDanishDelawareDominicanDutchDutch West IndianEastern EuropeanEcuadorianEgyptianEnglishEstonianEthiopianEuropeanFijianFilipinoFinnishFrenchFrench American IndianFrench CanadianGermanGerman RussianGhanaianGreekGuamanian/ChamorroGuatemalanGuyaneseHaitianHmongHonduranHopiHoumaHungarianIcelanderIndian (Asian)IndonesianInupiatIranianIraqiIrishIroquoisIsraeliItalianJamaicanJapaneseJordanianKenyanKiowaKoreanLaotianLatvianLebaneseLiberianLithuanianLumbeeLuxembourgerMacedonianMalaysianMalteseMarshalleseMenomineeMexicanMexican American IndianMongolianMoroccanNative HawaiianNavajoNepaleseNew ZealanderNicaraguanNigerianNorthern EuropeanNorwegianOkinawanOsageOttawaPaiutePakistaniPalestinianPanamanianParaguayanPennsylvania GermanPeruvianPimaPolishPortuguesePotawatomiPuebloPuerto RicanPuget Sound SalishRomanianRussianSalvadoranSamoanScandinavianScotch-IrishScottishSeminoleSenegaleseSerbianShoshoneSierra LeoneanSiouxSlavicSlovakSloveneSomaliSouth AfricanSouth AmericanSouth American IndianSoviet UnionSpaniardSpanishSpanish AmericanSpanish American IndianSri LankanSubsaharan AfricanSudaneseSwedishSwissSyrianTaiwaneseThaiTlingit-HaidaTohono O'OdhamTonganTrinidadian and TobagonianTsimshianTurkishU.S. Virgin IslanderUgandanUkrainianUruguayanUteVenezuelanVietnameseWelshWest IndianYakamaYaquiYugoslavianYumanYup'ikZimbabwean
Immigration
NonimmigrantsImmigrantsAfghanistanAfricaAlbaniaArgentinaArmeniaAsiaAustraliaAustriaBahamasBangladeshBarbadosBelarusBelgiumBelizeBoliviaBosnia and HerzegovinaBrazilBulgariaBurma/MyanmarCabo VerdeCambodiaCameroonCanadaCaribbeanCentral AmericaChileChinaColombiaCongoCosta RicaCroatiaCubaCzechoslovakiaDenmarkDominicaDominican RepublicEastern AfricaEastern AsiaEastern EuropeEcuadorEgyptEl SalvadorEnglandEritreaEthiopiaEuropeFijiFranceGermanyGhanaGreeceGrenadaGuatemalaGuyanaHaitiHondurasHong KongHungaryIndiaIndonesiaIranIraqIrelandIsraelItalyJamaicaJapanJordanKazakhstanKenyaKoreaKuwaitLaosLatin AmericaLatviaLebanonLiberiaLithuaniaMalaysiaMexicoMicronesiaMiddle AfricaMoldovaMoroccoNepalNetherlandsNicaraguaNigeriaNorth AmericaNorth MacedoniaNorthern AfricaNorthern EuropeNorwayOceaniaPakistanPanamaPeruPhilippinesPolandPortugalRomaniaRussiaSaudi ArabiaScotlandSenegalSerbiaSierra LeoneSingaporeSomaliaSouth AfricaSouth AmericaSouth Central AsiaSouth Eastern AsiaSouthern EuropeSpainSri LankaSt. Vincent and the GrenadinesSudanSwedenSwitzerlandSyriaTaiwanThailandTrinidad and TobagoTurkeyUgandaUkraineUruguayUzbekistanVenezuelaVietnamWest IndiesWestern AfricaWestern AsiaWestern EuropeYemenZaireZimbabweAzores
Costa Rican
Race
Ancestry
AfghanAfricanAlaska NativeAlaskan AthabascanAlbanianAleutAlsatianAmericanApacheArabArapahoArgentineanArmenianAssyrian/Chaldean/SyriacAustralianAustrianBahamianBangladeshiBarbadianBasqueBelgianBelizeanBermudanBhutaneseBlackfeetBolivianBrazilianBritishBritish West IndianBulgarianBurmeseCajunCambodianCanadianCape VerdeanCarpatho RusynCelticCentral AmericanCentral American IndianCherokeeCheyenneChickasawChileanChineseChippewaChoctawColombianColvilleComancheCosta RicanCreeCreekCroatianCrowCubanCypriotCzechCzechoslovakianDanishDelawareDominicanDutchDutch West IndianEastern EuropeanEcuadorianEgyptianEnglishEstonianEthiopianEuropeanFijianFilipinoFinnishFrenchFrench American IndianFrench CanadianGermanGerman RussianGreekGuamanian/ChamorroGuatemalanGuyaneseHaitianHmongHonduranHopiHoumaHungarianIcelanderIndian (Asian)IndonesianInupiatIranianIraqiIrishIroquoisIsraeliItalianJamaicanJapaneseJordanianKenyanKiowaKoreanLaotianLatvianLebaneseLiberianLithuanianLumbeeLuxembourgerMacedonianMalaysianMalteseMarshalleseMenomineeMexicanMexican American IndianMongolianMoroccanNative HawaiianNavajoNepaleseNew ZealanderNicaraguanNigerianNorthern EuropeanNorwegianOkinawanOsageOttawaPaiutePakistaniPalestinianPanamanianParaguayanPennsylvania GermanPeruvianPimaPolishPortuguesePotawatomiPuebloPuerto RicanPuget Sound SalishRomanianRussianSalvadoranSamoanScandinavianScotch-IrishScottishSeminoleSenegaleseSerbianShoshoneSierra LeoneanSiouxSlavicSlovakSloveneSomaliSouth AfricanSouth AmericanSouth American IndianSoviet UnionSpaniardSpanishSpanish AmericanSpanish American IndianSri LankanSubsaharan AfricanSudaneseSwedishSwissSyrianTaiwaneseThaiTlingit-HaidaTohono O'OdhamTonganTrinidadian and TobagonianTsimshianTurkishU.S. Virgin IslanderUgandanUkrainianUruguayanUteVenezuelanVietnameseWelshWest IndianYakamaYaquiYugoslavianYumanYup'ikZimbabwean
Immigration
NonimmigrantsImmigrantsAfghanistanAfricaAlbaniaArgentinaArmeniaAsiaAustraliaAustriaBahamasBangladeshBarbadosBelarusBelgiumBelizeBoliviaBosnia and HerzegovinaBrazilBulgariaBurma/MyanmarCabo VerdeCambodiaCameroonCanadaCaribbeanCentral AmericaChileChinaColombiaCongoCosta RicaCroatiaCubaCzechoslovakiaDenmarkDominicaDominican RepublicEastern AfricaEastern AsiaEastern EuropeEcuadorEgyptEl SalvadorEnglandEritreaEthiopiaEuropeFijiFranceGermanyGhanaGreeceGrenadaGuatemalaGuyanaHaitiHondurasHong KongHungaryIndiaIndonesiaIranIraqIrelandIsraelItalyJamaicaJapanJordanKazakhstanKenyaKoreaKuwaitLaosLatin AmericaLatviaLebanonLiberiaLithuaniaMalaysiaMexicoMicronesiaMiddle AfricaMoldovaMoroccoNepalNetherlandsNicaraguaNigeriaNorth AmericaNorth MacedoniaNorthern AfricaNorthern EuropeNorwayOceaniaPakistanPanamaPeruPhilippinesPolandPortugalRomaniaRussiaSaudi ArabiaScotlandSenegalSerbiaSierra LeoneSingaporeSomaliaSouth AfricaSouth AmericaSouth Central AsiaSouth Eastern AsiaSouthern EuropeSpainSri LankaSt. Vincent and the GrenadinesSudanSwedenSwitzerlandSyriaTaiwanThailandTrinidad and TobagoTurkeyUgandaUkraineUruguayUzbekistanVenezuelaVietnamWest IndiesWestern AfricaWestern AsiaWestern EuropeYemenZaireZimbabweAzores
11th Grade
Income
Poverty
Unemployment
Labor Participation
Family Structure
Vehicle Availability
Education Level
Disability

11th Grade Comparison

Ghanaians

Costa Ricans

Tragic
Tragic
91.5%
11TH GRADE
0.9/ 100
METRIC RATING
250th/ 347
METRIC RANK
91.9%
11TH GRADE
6.3/ 100
METRIC RATING
224th/ 347
METRIC RANK

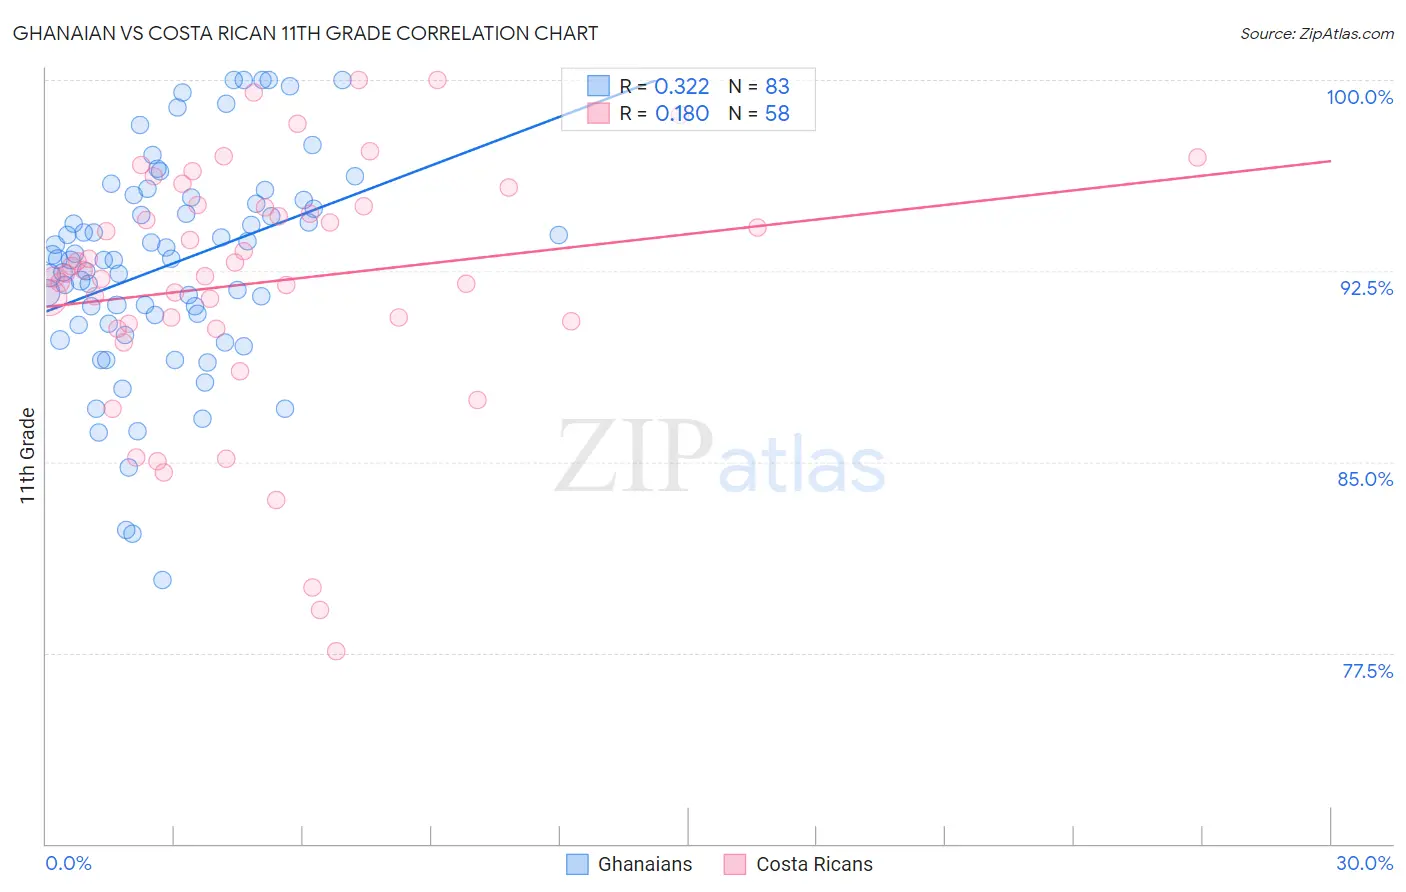
Ghanaian vs Costa Rican 11th Grade Correlation Chart

The statistical analysis conducted on geographies consisting of 190,714,079 people shows a mild positive correlation between the proportion of Ghanaians and percentage of population with at least 11th grade education in the United States with a correlation coefficient (R) of 0.322 and weighted average of 91.5%. Similarly, the statistical analysis conducted on geographies consisting of 253,601,730 people shows a poor positive correlation between the proportion of Costa Ricans and percentage of population with at least 11th grade education in the United States with a correlation coefficient (R) of 0.180 and weighted average of 91.9%, a difference of 0.48%.
Ghanaian vs Costa Rican 11th Grade

11th Grade Correlation Summary

MeasurementGhanaianCosta Rican
Minimum80.3%77.5%
Maximum100.0%100.0%
Range19.7%22.5%
Mean92.7%92.0%
Median93.0%92.5%
Interquartile 25% (IQ1)90.4%90.4%
Interquartile 75% (IQ3)95.3%95.1%
Interquartile Range (IQR)4.9%4.6%
Standard Deviation (Sample)4.2%4.9%
Standard Deviation (Population)4.2%4.9%

Similar Demographics by 11th Grade

Demographics Similar to Ghanaians by 11th Grade

In terms of 11th grade, the demographic groups most similar to Ghanaians are Peruvian (91.5%, a difference of 0.0%), Immigrants from Philippines (91.5%, a difference of 0.010%), Immigrants from Uzbekistan (91.5%, a difference of 0.010%), Immigrants from Costa Rica (91.4%, a difference of 0.020%), and Immigrants from Nigeria (91.4%, a difference of 0.030%).
DemographicsRating | Rank11th Grade
Immigrants | Thailand
1.4
/100
|
#243
Tragic
91.6%
Senegalese
1.4
/100
|
#244
Tragic
91.6%
Africans
1.3
/100
|
#245
Tragic
91.5%
Seminole
1.2
/100
|
#246
Tragic
91.5%
Immigrants | Philippines
1.0
/100
|
#247
Tragic
91.5%
Immigrants | Uzbekistan
1.0
/100
|
#248
Tragic
91.5%
Peruvians
1.0
/100
|
#249
Tragic
91.5%
Ghanaians
0.9
/100
|
#250
Tragic
91.5%
Immigrants | Costa Rica
0.9
/100
|
#251
Tragic
91.4%
Immigrants | Nigeria
0.8
/100
|
#252
Tragic
91.4%
Immigrants | South America
0.8
/100
|
#253
Tragic
91.4%
Immigrants | Eritrea
0.7
/100
|
#254
Tragic
91.4%
Blacks/African Americans
0.7
/100
|
#255
Tragic
91.4%
Immigrants | Senegal
0.7
/100
|
#256
Tragic
91.4%
Cajuns
0.7
/100
|
#257
Tragic
91.4%

Demographics Similar to Costa Ricans by 11th Grade

In terms of 11th grade, the demographic groups most similar to Costa Ricans are Immigrants from Africa (91.9%, a difference of 0.010%), Immigrants from Bahamas (91.9%, a difference of 0.010%), Immigrants from Liberia (91.9%, a difference of 0.030%), Immigrants from Zaire (91.9%, a difference of 0.040%), and South American Indian (92.0%, a difference of 0.050%).
DemographicsRating | Rank11th Grade
Immigrants | Sierra Leone
11.1
/100
|
#217
Poor
92.0%
Blackfeet
10.1
/100
|
#218
Poor
92.0%
Portuguese
10.0
/100
|
#219
Tragic
92.0%
South American Indians
7.6
/100
|
#220
Tragic
92.0%
Immigrants | Liberia
7.0
/100
|
#221
Tragic
91.9%
Immigrants | Africa
6.5
/100
|
#222
Tragic
91.9%
Immigrants | Bahamas
6.5
/100
|
#223
Tragic
91.9%
Costa Ricans
6.3
/100
|
#224
Tragic
91.9%
Immigrants | Zaire
5.4
/100
|
#225
Tragic
91.9%
Immigrants | Somalia
5.2
/100
|
#226
Tragic
91.9%
Immigrants | Cameroon
4.4
/100
|
#227
Tragic
91.8%
Immigrants | Panama
4.3
/100
|
#228
Tragic
91.8%
Nigerians
4.3
/100
|
#229
Tragic
91.8%
Immigrants | Afghanistan
3.9
/100
|
#230
Tragic
91.8%
Choctaw
3.7
/100
|
#231
Tragic
91.8%